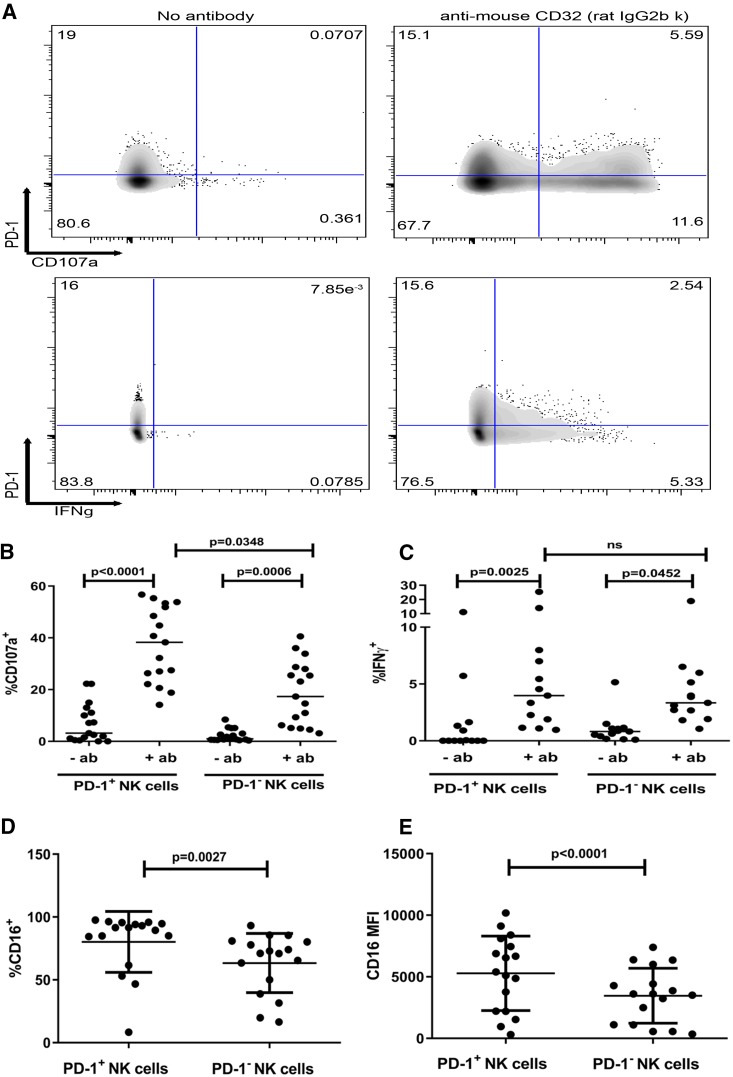
FIG 5.
PD-1 expression is associated with enhanced NK cell degranulation following stimulation of CD16 by ADCC. (A) Representative flow cytometry plots of CD107a (upper panels)- and IFN-γ (lower panels)-producing NK cells among PBMCs after 5 h of stimulation with antibody-coated (anti-mouse CD32) versus uncoated (no antibody) P815 cells. (B and C) Percentage of CD107a-positive (B) and IFN-γ-positive (C) NK cells stratified by PD-1 expression following stimulation of PBMCs with antibody-coated P815 cells. (D) Percentage of CD16-expressing PD-1+ and PD-1− NK cells. (E) CD16 MFI on PD-1+ and PD-1− NK cells. (B and C) Data are shown as medians. P values were determined by the Friedman test, adjusted for multiple comparisons. (D and E) Data are shown as means ± SD. P values were determined by a paired t test.

