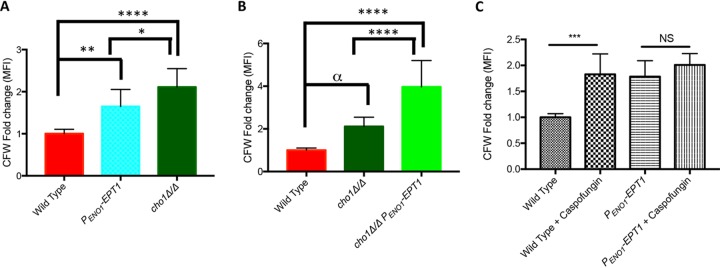
FIG 7.
Overexpression of EPT1 increases total chitin. To measure chitin levels, cells were stained with calcofluor white (CFW) and then measured by flow cytometry. (A and B) Cells were grown overnight in YPD before staining (n = 9/strain; *, P = 0.0259; **, P = 0.0017; ****, P < 0.0001; α, P = 0.0131, all measured by one-way ANOVA). (C) Untreated and 47 ng/ml caspofungin-treated (30 min) cells were stained with CFW and measured by flow cytometry (n = 6/strain; ***, P < 0.0001; NS, not significant; unpaired t test; MFI, mean fluorescent intensity).

