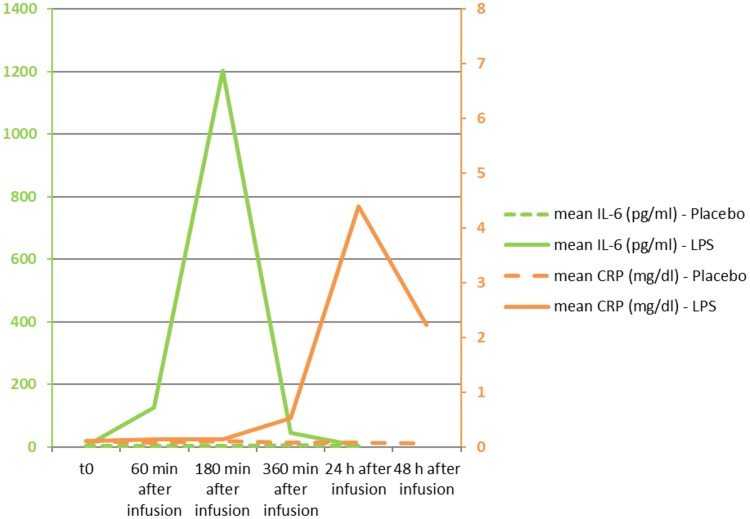
FIG 1.
Mean plasma concentrations of interleukin-6 (IL-6) and C-reactive protein (CRP). The difference between placebo and LPS administration was statistically significant for IL-6 (P = 0.018) as well as CRP (P < 0.001), as measured by RM-ANOVA. IL-6 values are given in picograms per milliliter on the lefthand side; the assay’s upper limit of normal is 15 pg/ml. CRP values are given in milligrams per deciliter on the righthand side; the assay’s upper limit of normal is 1.0 mg/dl.

