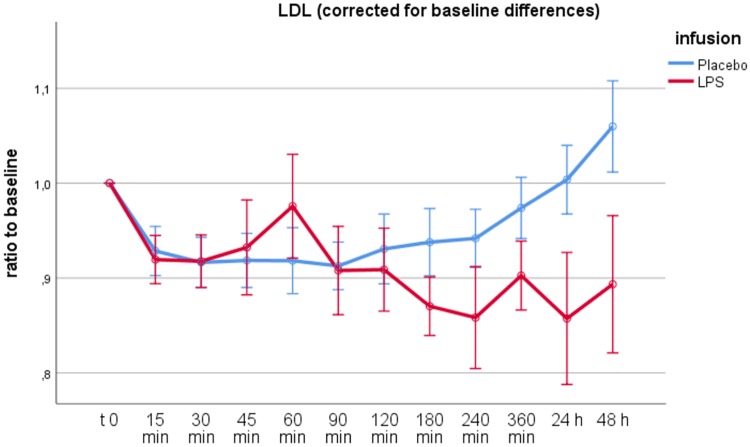
FIG 3.
RM-ANOVA for LDL. The difference in LDL plasma concentrations between placebo and LPS administration was statistically significant (P < 0.001 using the Greenhouse-Geisser correction). Time points are shown on the abscissa, the ratio of LDL values to baseline is shown on the ordinate. Error bars depict 95% confidence intervals. Of note, there was a distinct peak in LDL levels 60 min after LPS administration. This relative elevation of LDL levels following LPS infusion was not statistically significant after correction for baseline difference (P = 0.065 using the Greenhouse-Geisser correction).

