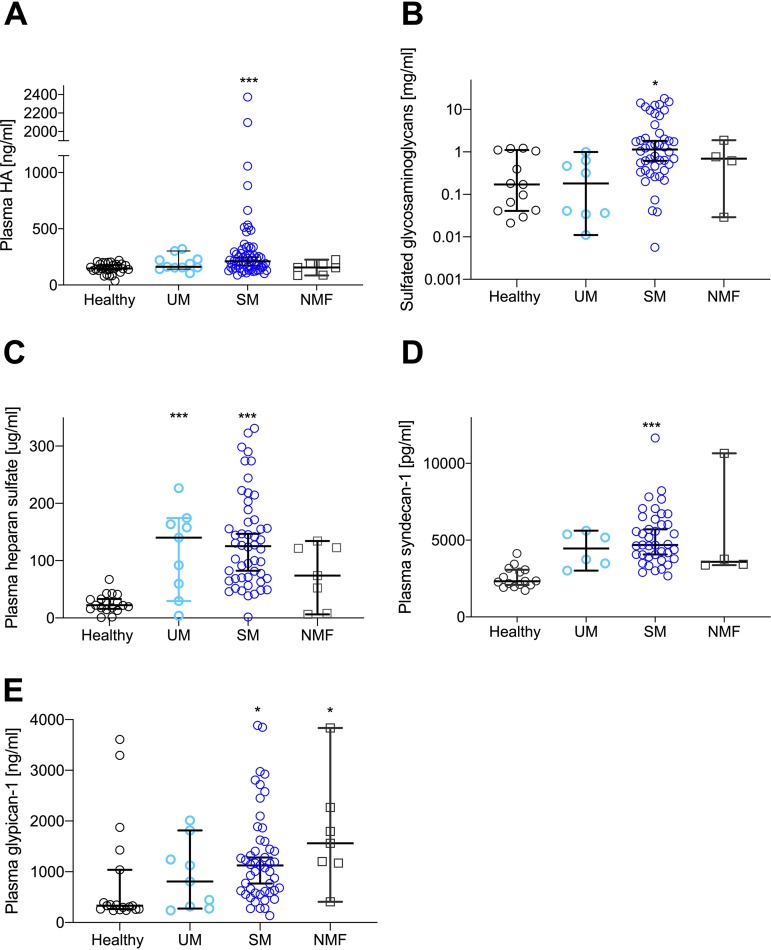
FIG 3.
Glycocalyx components are shed and detected at an increased level in the plasma of patients with SM. (A) Plasma HA increased significantly in SM patients (P < 0.0005) but not in patients with UM. (B) Sulfated GAGs in plasma increased significantly in patients with SM (P = 0.01) compared with healthy controls, and levels in SM patients were increased compared with those in UM patients (P = 0.02). (C) Plasma HS increased significantly in SM patients (P < 0.0001) and also in UM patients (P = 0.003). Plasma levels of HS were comparable in UM and SM patients. (D) Compared with that in healthy subjects, plasma syndecan-1 increased significantly in SM patients (P < 0.0001). Plasma levels of syndecan-1 were comparable in UM and SM patients. (E) Glypican-1 increased significantly in SM (P = 0.02) and NMF (P = 0.02) patients. Plasma levels of glypican-1 were comparable in UM and SM patients. All data points represent one individual. Data are summarized as medians, and error bars show 95% confidence intervals. ***, P value of <0.001; **, P value of <0.01 and >0.001; *, P value of <0.05 and >0.01.

