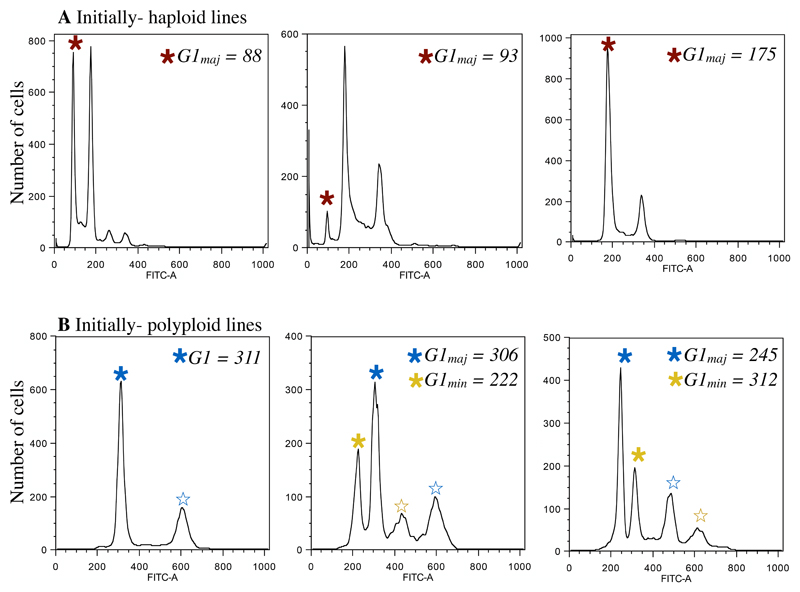
Figure 1. Ploidy analysis from plots of FITC intensity.
A) Three representative flow profiles after evolution from initially haploid lines. In each plot the major ploidy peak (G1maj) is indicated by a red star. Due to ambiguity between the haploid G2 and diploid G1 peak, if a haploid G1 peak was present, regardless of height, this peak was recorded as G1maj (center panel). B). Three representative flow profiles after evolution from initially polyploid lines. In each plot the mean of the major ploidy peak (G1maj) is indicated by a blue star. For initially diploid and polyploid lines, when more than two peaks were present (indicative of a polymorphic population), we recorded G1maj from the highest peak (blue star) and G1min from the next highest peak (yellow star). Note that because we assay cells at all stages of the cell cycle, we did not record the mean of peaks that are consistent with the G2 phase (open stars).

