Figure 5.
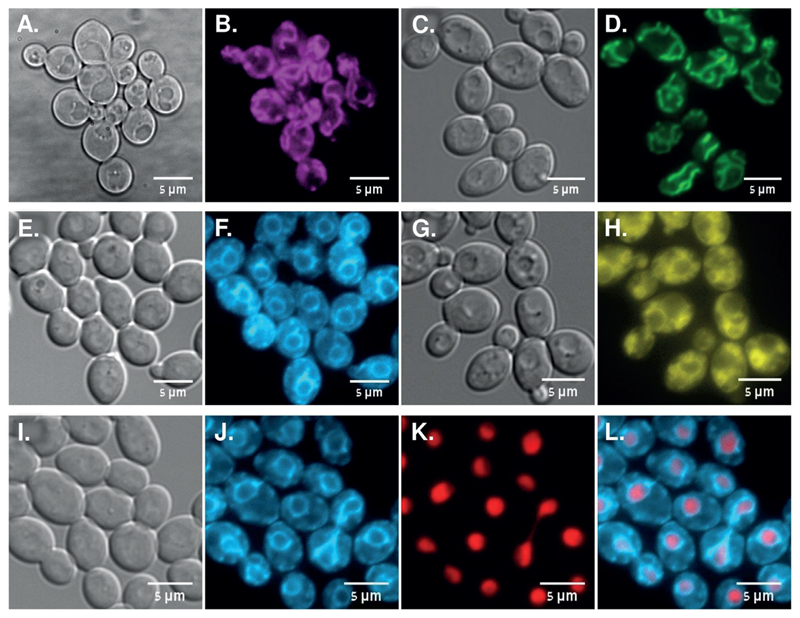
Localization of antifungal azoles relative to mitochondrial, ER, and nuclear structures in live C. albicans SC5314 cells. A,B) Azole 2 (magenta, 10 μg mL−1) after 120 min. C,D) MitoTracker (green, 10 nm) after 60 min. E,F) Azole 3 (cyan, 1 μg mL−1) after 120 min. G,H) DiOC6—ER tracker (yellow,1 μg mL−1) after 5 min. I,J,K,L) Azole 3 (cyan) in cells expressing Eno1-mCherry nuclear protein (red) after 120 min. The bandpass filters used to image azole 2 were excitation 390/40 nm and emission 520/20 nm and filter sets used to image 3 and DiOC6 staining were excitation 440 nm and emission 480/40 nm. For MitoTracker green FM excitation 470 nm and emission 525/50 nm and for Eno1-mCherry excitation 585 nm and emission 630/75 nm.

