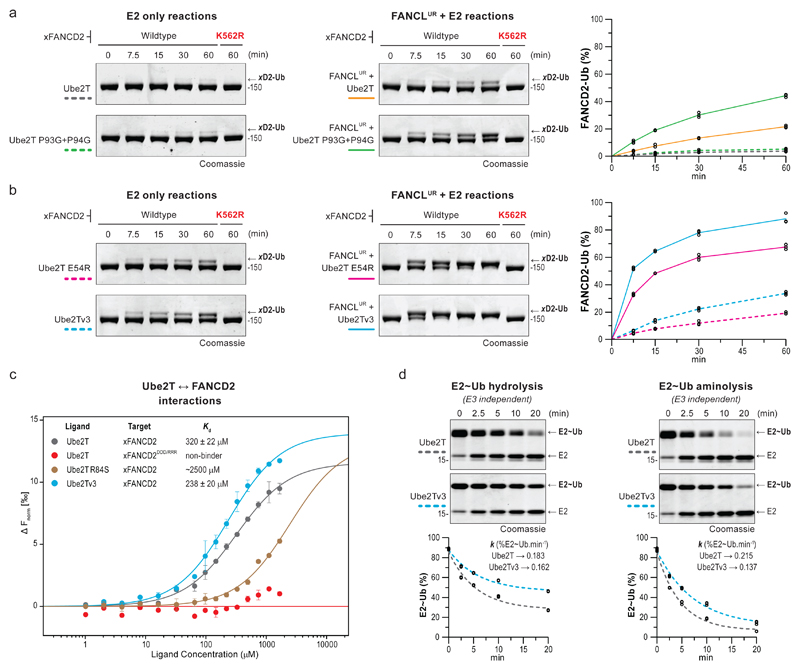
Fig 5. Ube2Tv3 enhances E3-dependent and E3-independent FANCD2 monoubiquitination.
a, b, Monoubiquitination of xFANCD2 (n=3) is improved by a Ube2T variant with a flexible loop7 (Ube2TP93G+P94G) only in the presence of FANCLUR. In contrast, xFANCD2 monoubiquitination is enhanced by Ube2Tv3, which includes a permissive gate (E54R) and a flexible loop7 (P93G+P94G), both in the presence and absence of FANCLUR. Reactions were also performed with xFANCD2 K562R mutant to assess site-specificity. c, MST dose-response-curves for interactions between Ube2T (Ligand) against xFANCD2 (Target). Curves were fitted to a one-site binding model for Kd determination and plotted against baseline corrected normalized fluorescence (Δ Fnorm [‰]). Mutation of the target acidic patch on xFANCD2 (D555R+D554R+D521R or xFANCD2DDD/RRR) or a basic residue in Ube2T’s active site (R84S) weakens or abolishes E2-substrate interactions. A minor improvement in xFANCD2 interaction is observed with Ube2Tv3. To allow for high ligand concentrations, Ube2T1-152 is used and indicated mutations incorporated in this background. All measurements were done in triplicates, error bars indicate standard deviation. d, Single-turnover assays to assess hydrolysis and aminolysis (20 mM lysine) of the E2~Ub thioester (3 µM). To prevent E2 auto-ubiquitination, Ube2T1-152, K91R is used and mutations incorporated in this background. Percentage of E2~Ub (n=3) were plotted over time and fitted with one-phase decay model (see Supplementary Fig. 7d for best-fit values and the goodness of fit). k denotes the rate constant (%E2~Ub.min-1). The Ube2Tv3~Ub thioester is relatively more stable than Ube2T~Ub in both reactions. Raw images in Supplementary Fig. 11.

