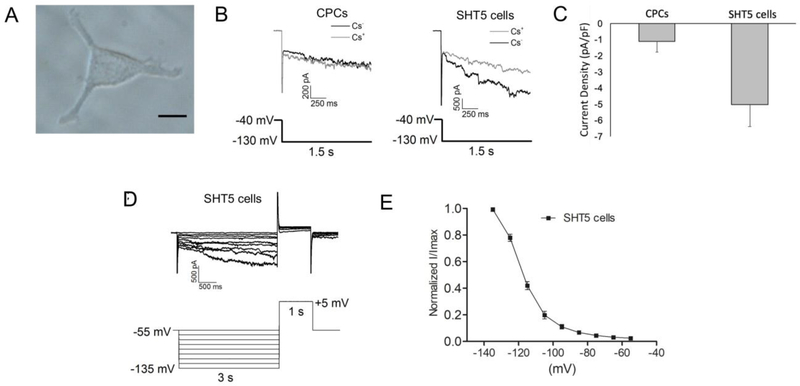
Figure-4: Whole Cell electrophysiological recordings of functional SHT5 reprogrammed cells.
(A) A representative image of an SHT5 mCherry+ cell used for the electrophysiological recording. (B) Whole-cell current traces were recorded from the CPCs (left panel) or the SHT5 mCherry+ (HCN positive) cells (right panel) in the absence (gray) and presence (black) of 5 mM Cs+. The voltage protocol is indicated below the traces. The HCN current was defined as the Cs+-sensitive fraction of the hyperpolarization-activated current. (C) The current density (pA/pF) from SHT5 cells (−5.03±1.36, n=17) is significantly higher than the current density recorded from CPCs (−1.12±0.64, n=21). (D) A series hyperpolarizing step command followed by a depolarization step was applied to determine the channel activation kinetics. Traces recorded from a representative SHT5 cell is shown. (E) The Cs+ sensitive current at each voltage-step (I) was normalized to the peak current (Imax at −135 mV), and the I/Imax was plotted then fitted with the Boltzmann equation: I/Imax = 1 / [1-exp ((V1/2-V) / k)]. The voltage eliciting half of the maximal current (I/Imax at 0.5) was calculated as −125.28±3.83 mV for the SHT5 (HCN4 positive) cells (n=14).

