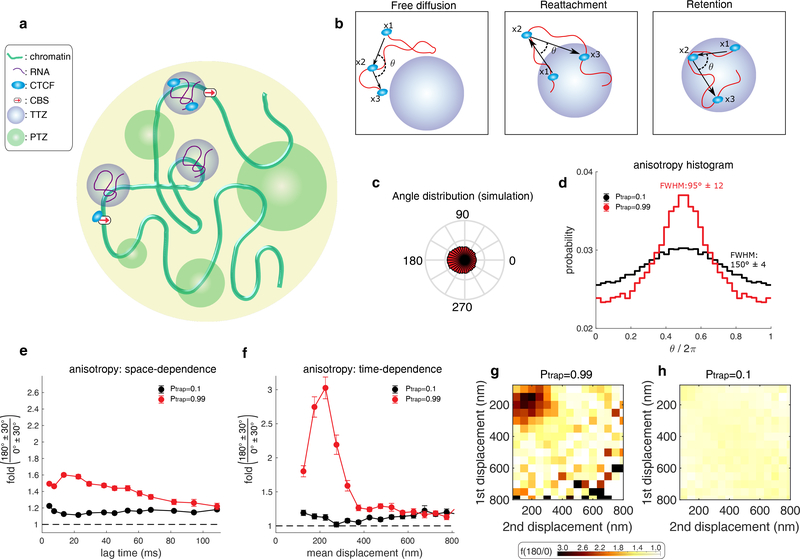
Figure 2. A model wherein CTCF diffusion in the nucleus is governed by its interaction with trapping zones can explain the experimental data.
(a) CTCF (light blue ellipse) diffuses inside the nucleus (large yellow circle). It interacts with one of three zone types: (1) small, Cognate DNA Binding Sites (CBSs) (red arrow). (2) Transiently trapping zones (TTZs) of size 200 nm (purple). (3) Trapping zones of different dimensions, whose size is derived from a power-law distribution (Power-law distributed Trapping Zones – PTZs – green; for details about PTZs, please see Fig. 3 and below).
(b) The protein (light blue) is observed at 3 time points (x1, x2, x3) along its stochastic trajectory (red curve). Left: Outside of the zones, CTCF performs free diffusion. The angle of two consecutive steps is uniformly distributed for this mode of motion. Middle: If CTCF leaves a TTZ (x1), diffuses freely (x2), and then reattaches back to the TTZ (x3), the angle distribution is anisotropic. Right: While inside a zone, CTCF can be reflected from its boundary. The angle distribution, in this case, will be anisotropic
(c) The angle distribution for a protein performing diffusion in a nucleus containing only CBSs and TTZs. See Supplementary Table 2 for the simulation parameters.
(d) Angle distribution of the trajectory computed from the simulation when the nucleus contains only zones of type 1 and 2 (CBSs and TTZs). CTCF is trapped with high probability (Ptrap = 0.99) when touching the zones (red curve). (black curve). The protein is trapped with low probability (Ptrap = 0.1) when touching the zone (black curve).
(e) Plot of f180/0 vs. lag time averaging over all displacement lengths of the simulation data shown in d.
(f) Plot of f180/0 vs. mean displacement length averaging over all lag times. The data shown in (e-f) is the result of n=30 independent simulations. In each simulation, the trajectory of CTCF was recoded until its 10000’s capture event. Error bars in (e-f) show standard deviation from 50 subsamplings with replacement using 50% of the data and centre values show value using 100% of the data.
(g-h) Anisotropy heatmaps showing f180/0 vs. length of the first and second displacement for high binding probability (Ptrap = 0.99) (g) and for smaller binding probability (Ptrap = 0.1) (h). See Supplementary Table 2 for the full parameters used.

