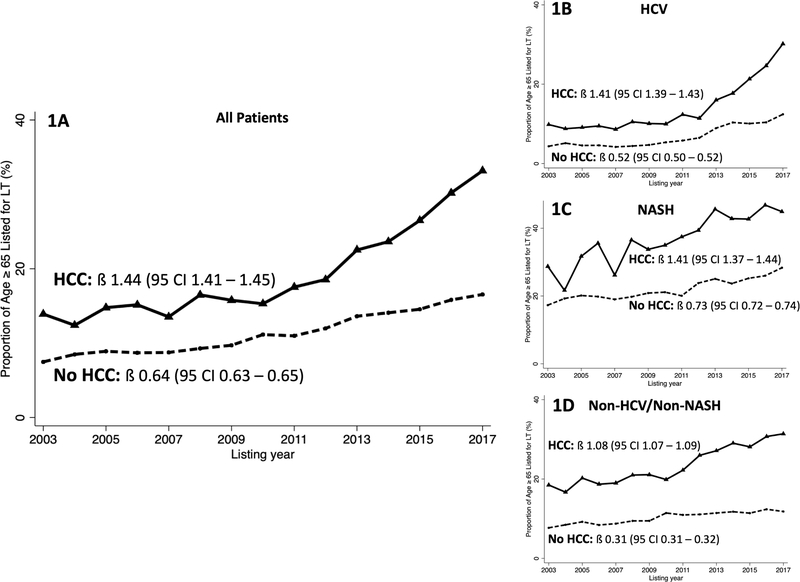
Figure 1. Trends in the proportion of patients listed for liver transplant in the United States between 2003 and 2017 who are ≥65 years at time of listing.
(A) Proportion of all listed patients ≥65 years by HCC status. (B) Proportion of listed patients with HCV cirrhosis ≥65 years by HCC status. (C) Proportion of listed patients with NASH cirrhosis ≥65 years by HCC status. (D) Proportion of listed patients with Non-HCV/non-NASH cirrhosis ≥65 years by HCC status. β represents regression coefficient.

