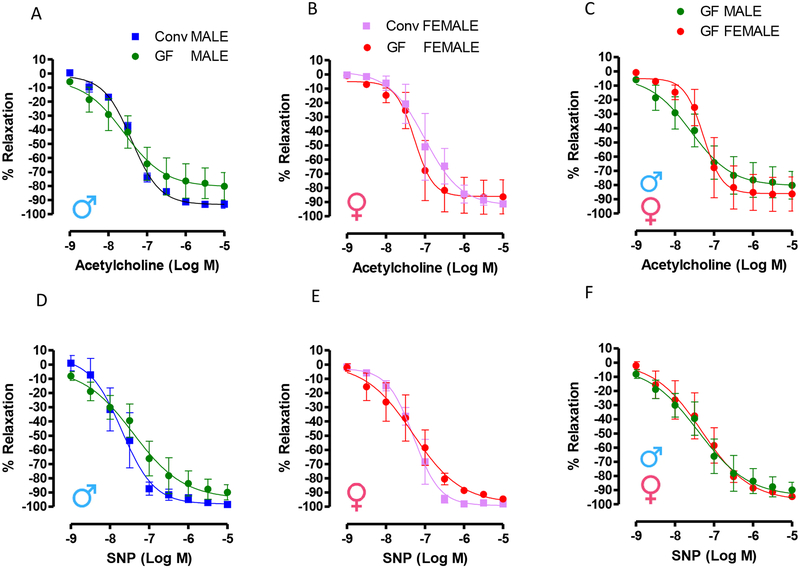
Figure 4.
(A) (B) and (C) show concentration-response curves to acetylcholine and (D), (E) and (F) represent concentration-response curves to sodium nitroprusside (SNP) in mesenteric resistance arteries from 7–8 weeks old male and female Conv or GF mice. All arteries were initially contracted with phenylephrine (10 μM/L). Number of animals used per group are = 3. Samples were examined in duplicate. Values are mean ± SEM. No differences were observed in EC50 and Emax (Student’s t test, p >0.05) or variation between groups (Two-way ANOVA, p >0.05).

