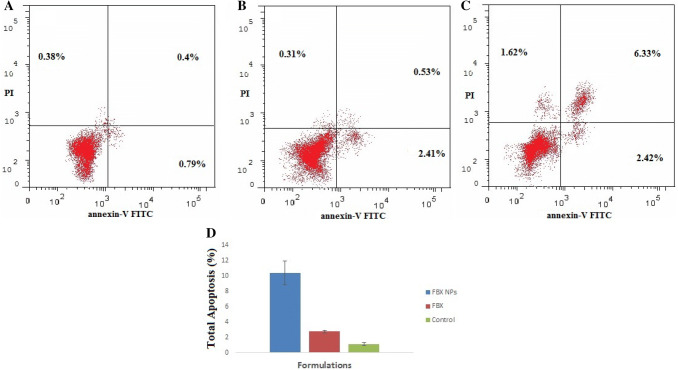
Fig. 4.
Dot plots of FACS analysis using an annexin V-FITC probe showed induction of apoptotic cell death: a control group, b free FBX, and c FBX NPs. d Bar graphs of FACS analysis showing greater apoptotic cell death induced by FBX NPs treatment compared to free FBX. The data were analyzed using one-way ANOVA followed by Tukey's post hoc test. Percentage of cells in each group was compared with control; p < 0.05 indicates a significant difference

