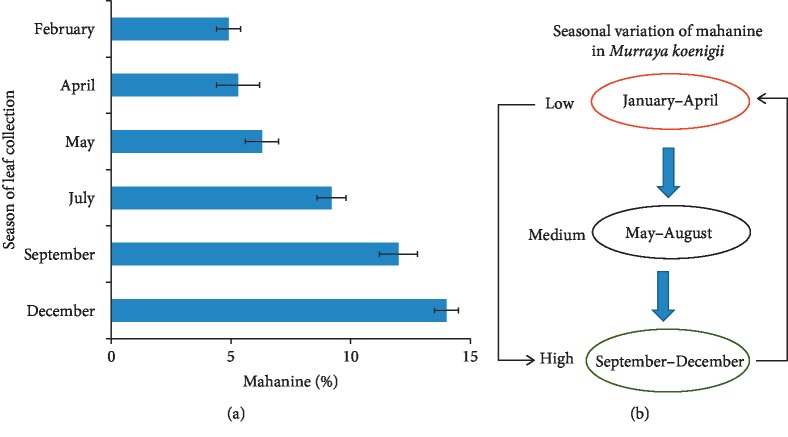
Figure 3.
Seasonal variation of mahanine in MEFWB. (a) MEFWB prepared from the leaflets collected during different seasons was analyzed by HPLC. The variations in percent of mahanine were plotted on the graph. (b) Schematic representation of seasonal variations of mahanine from low to high. These data were derived from three individual experiments, and mean ± SD was indicated.

