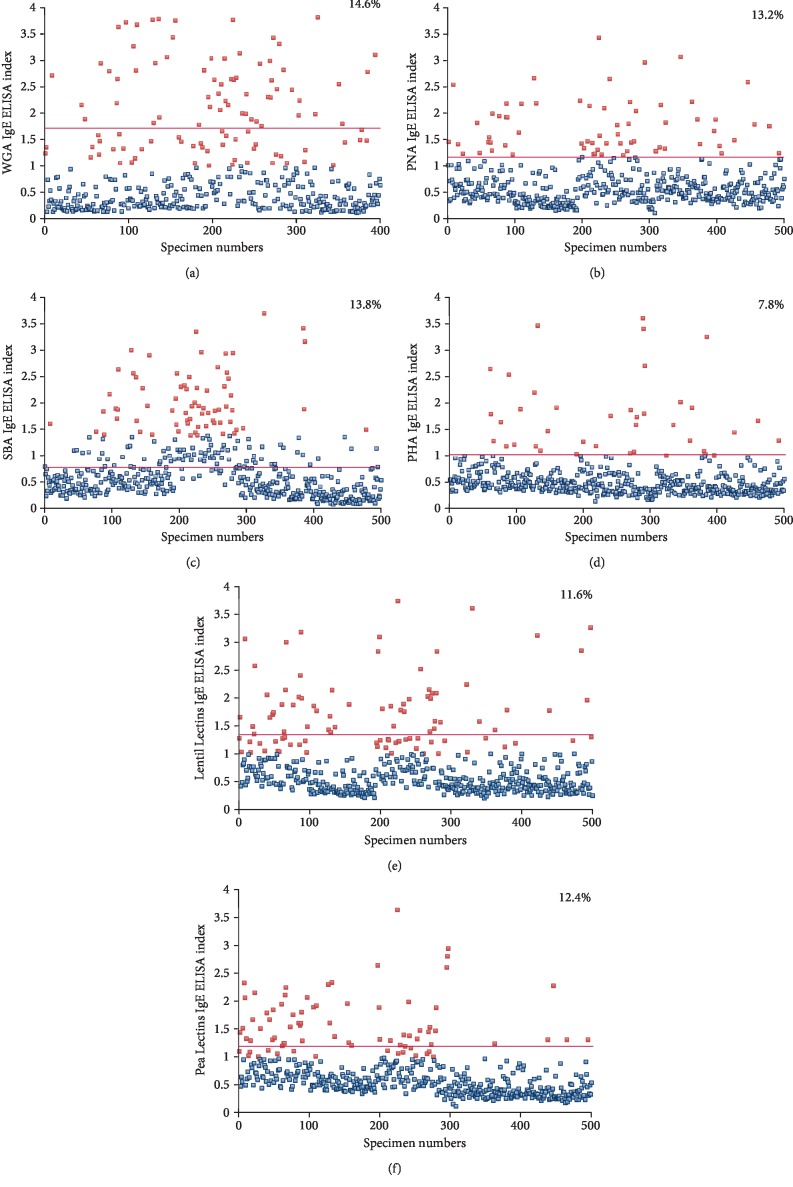
Figure 4.
Prevalence of IgE antibodies against 6 different lectins in 500 samples. Results for IgE against (a) WGA, (b) PNA, (c) SBA, (d) PHA, (e) lentil lectin, and (f) pea lectin in the sera of 500 blood donors expressed as ELISA index with percentages of elevation. Cutoff points (red lines) are calculated from the mean + 2 standard deviation of each group.

