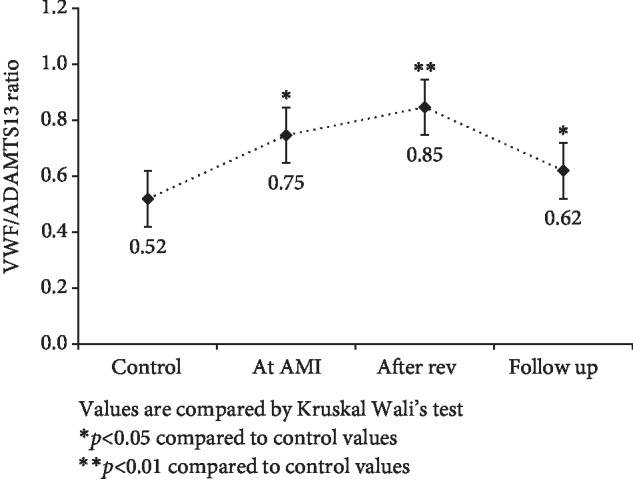
Figure 3.

Comparison of VWF/ADAMTS13 ratio in control, at AMI, after revascularization and at 4–6 weeks of follow-up in AMI patients with control subjects. Values are compared by Kruskal Wallis test. ∗p < 0.05 compared to control values. ∗∗p < 0.01 compared to control values.
