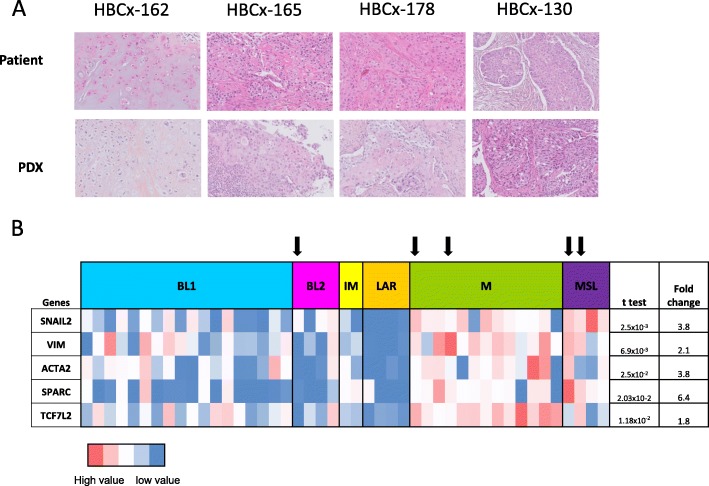
Fig. 2.
a Morphological comparison of four patients and PDX tumors (representative hematoxylin-eosin (H&E)-stained sections, magnification × 200). HBCx-162: metaplastic carcinoma with abundant chondromyxoid matrix in both patients and PDX tumors; HBCx-165, HBCx-178, HBCx-130: squamous cell metaplastic carcinoma, in both patients and PDXs. b RT-PCR analysis of the expression of EMT genes (SNAIL2, VIM, ACTA2, SPARC, TCF7L2) in TNBC PDXs (n = 48). Fold changes and p values are calculated for the comparison of gene expression in MSL and M PDXs with that in other TNBC subtypes. Arrow down symbol indicates metaplastic type

