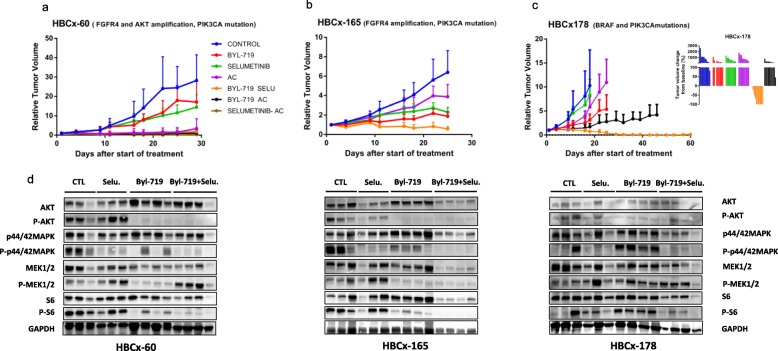
Fig. 4.
In vivo response to targeted therapies and chemotherapy in metaplastic PDXs. a, b Relative tumor growth (RTV) in HBCx-60 and HBCx-165 PDX models treated with BYL-719 (PI3KCa inhibitor) monotherapy, selumetinib (MEK inhibitor) monotherapy, chemotherapy with adriamycin and cyclophosphamide (AC), a combination of BYL-719 + selumetinib, BYL-719 + AC, and selumetinib + AC. Mean ± SD, N = 10 xenografts/group. c Relative tumor growth in the HBCx-178 PDX treated with BYL-719 (PI3KCa inhibitor) monotherapy, selumetinib (MEK inhibitor) monotherapy, chemotherapy with AC, or the combination of BYL-719 + selumetinib. d Western blot analysis of AKT, p-AKT (ser 473), S6, p-S6 (Ser235/236), ERK, p-ERK (Thr202/Tyr204), MEK, p-MEK (Ser217/221), and GAPDH in treated tumors of HBCx-60, HBCx-165, and HBCx-178. N = 3 − 4

