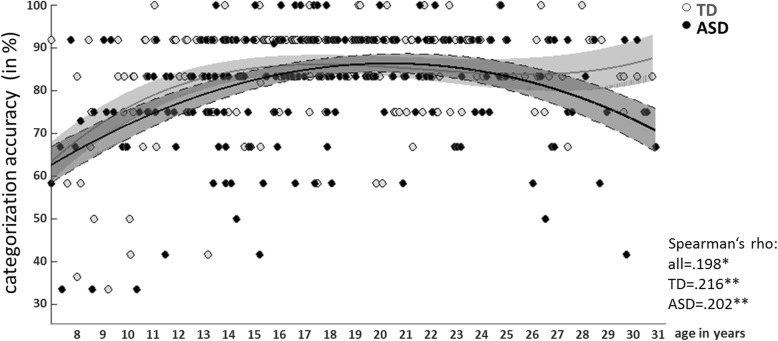
Fig. 1.
Overall categorization accuracy. Linear least square regression fits (third level polynomial) for TD (gray) and ASD (black) are shown for the full sample. Shaded areas represent 95% confidence intervals. Non-parametric correlation coefficients (Spearman’s rho) are reported for all subjects and separately for TD and ASD subjects.*p < .05, **p < .01

