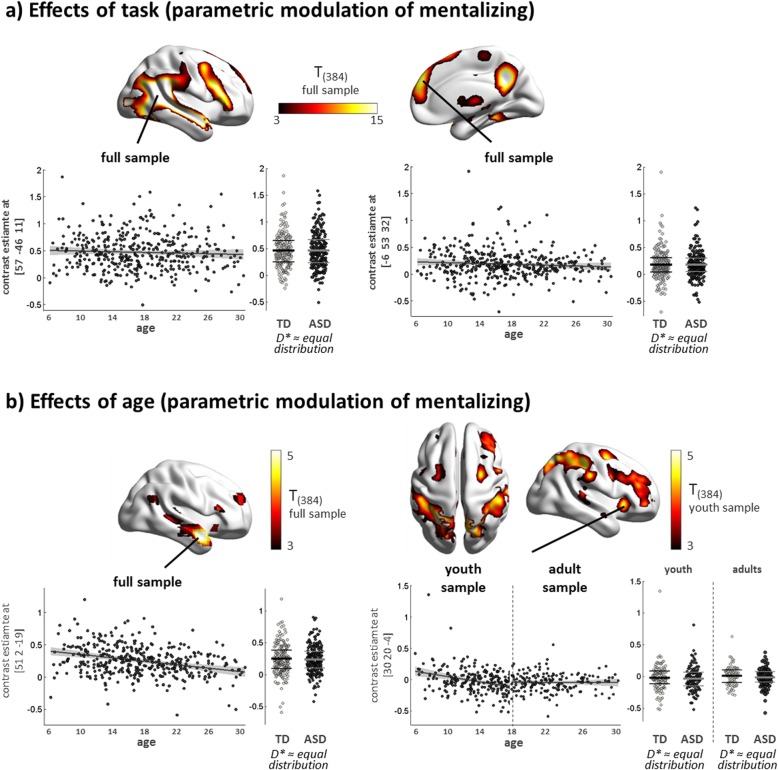
Fig. 2.
Functional activation to spontaneous mentalizing elicited by increasing social significance of animated video clips. a Render brains illustrate the positive effect of task (i.e., effect of increasing social significance) in the full sample. Scatter plots highlight functional responses in selected peak voxels in the right pSTS (left) and dmPFC (right). b Render brains illustrate the positive effect of age in the full sample (left) and youth sample (right), complemented by scatter plots of peak voxels in the right anterior temporal pole (left) and right anterior insula (right). Associations with age are displayed using a linear model fit (95% confidence interval indicated as shaded area). Distributions of peak voxel activation in cases and controls were compared using the Kolmogorov-Smirnov test, which suggested no evidence for unequal distributions (statistics for peak at [57, − 46, 11], full sample: D(205,189)* = .065, p = .789; for peak at [− 6, 53, 32], full sample: D(205,189)* = .044, p = .990, for peak at [51, 2, − 19], full sample: D(205,189)* = .061, p = .853; for peak at [30, 20, − 4], youth sample: D(111,105)* = .081, p = .855; adult sample: D(93,84)* = .140, p = .327). Distribution mean and 25th/75th percentiles are indicated as thick and thin lines within bee swarm plots, respectively. For illustration purposes, render brains are displayed at a significance threshold of t = 3 using BrainNet Viewer (http://www.nitrc.org/projects/bnv/). TD, typically developing; ASD, autism spectrum disorder; D*, test statistic of the Kolmogorov-Smirnov test

