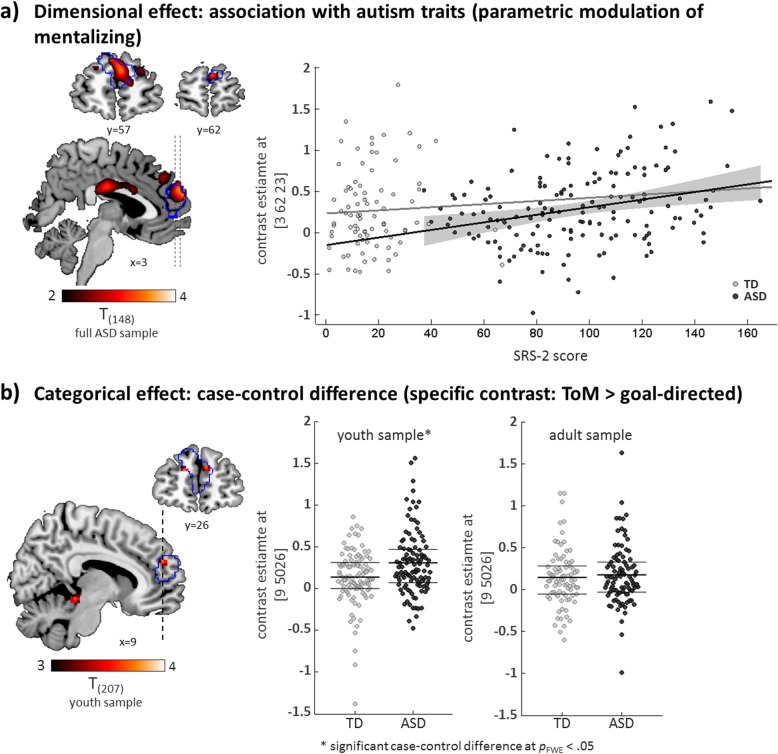
Fig. 3.
a Brain sections (left) illustrate the association of a continuous measure of autism traits, as assessed as parent-reported scores of the Social Responsiveness Scale-2 (SRS-2), with functional responses to increasing mentalizing demands in the dmPFC in individuals with ASD. The outline of the ROI in the dmPFC is displayed in blue. A scatter plot (right) demonstrates the distribution of autism trait scores and peak voxel activation in cases and controls, including linear model fits for each group. The 95% confidence interval for the significant linear model fit in the ASD group is displayed in gray. b Brain sections (left) illustrate the case-control difference for the specific contrast ToM > goal-directed in the dmPFC ROI (outlined in blue) in the youth sample. Scatter plots (right) display the distributions of peak voxel contrast estimates in the youth and adult sample, with mean and inner quartiles (25th to 75th percentile) indicated as thick and thin lines, respectively

