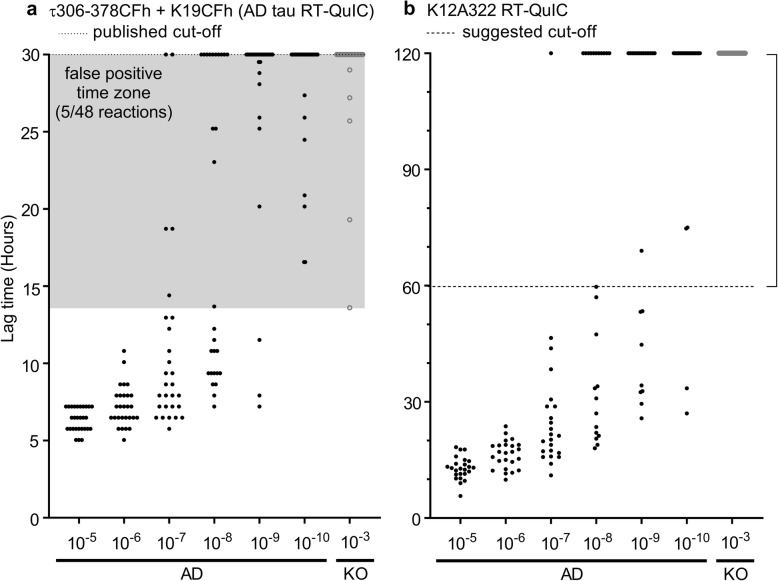
Fig. 5.
Comparison of the sensitivity of the AD RT-QuIC (a) and K12 RT-QuIC (b) assays. Data points represent the time for an individual reaction to exceed a ThT fluorescence threshold of 100 * SD of baseline fluorescence for the designated BH and dilution. Horizontally aligned overlapping points at 30 h (AD RT-QuIC) and 120 h (K12 RT-QuIC) represent reactions for which ThT fluorescence did not exceed the threshold, indicating no fibrils formed. Shaded area in a shows reaction times during which at least one replicate KO-seeded reaction exceeded the threshold. Bracket on upper right indicates time period in which the lack of spontaneous (KO-seeded) false positive reactions well beyond the assay cut-off time (60 h) enhances confidence in the true positives seeded by AD brain. Different lag time scales are used in panels a and b because of the different seeded polymerization kinetics obtained with the two assays. The 60–120 h timeframe is shown in b to document the increased stability of the K12 RT-QuIC with respect to spontaneous nucleation and polymerization in the absence of any tau seeds (i.e. in the presence of KO brain homogenate)

