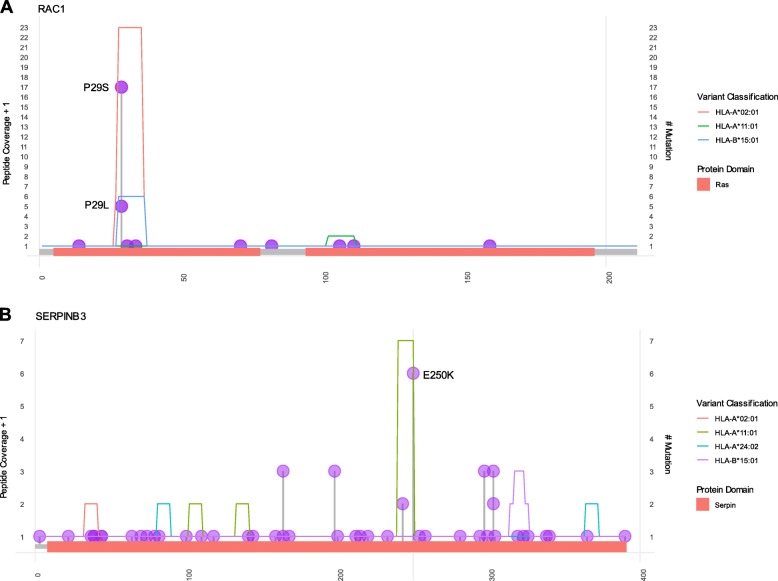
Fig. 3.
Distribution of recurrent missense mutations that generated high-affinity neoantigens. The y-axis shows peptide coverage based on the number of epitope binding predictions in each region. The coverage was calculated by increasing the overall frequency of each amino acid by one, including non-high-affinity regions. The allele classification is shown as colored lines. The x-axis shows the protein length, and also contains information about conserved domains for each protein. a P29S and RAC1 gene generated recurrent mutant peptides with strong affinity to HLA-A*02:01 and P29L generated peptides with strong affinity to HLA-A*02:01 or HLA-A*11:01, depending on peptide length (b) E250K in SERPINB3 gene generate a recurrent potential neoantigen that binds to HLA-A*11:01

