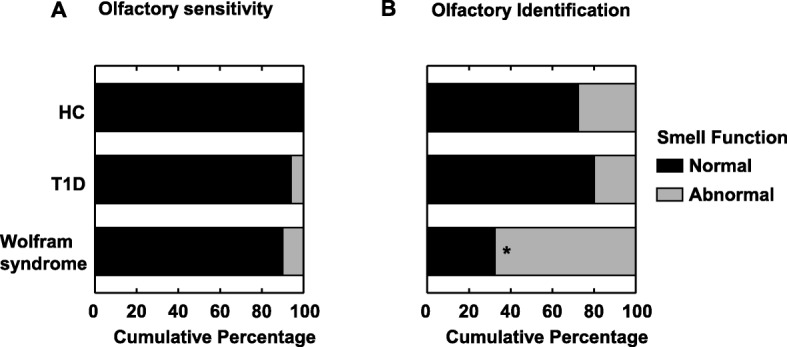
Fig. 1.

Olfactory function in participants with Wolfram syndrome and in two control groups: healthy controls (HC) and participants with Type 1 Diabetes Mellitus (T1D). a Olfactory sensitivity: Cumulative percentage of participants with a normal (in black) or abnormal (in grey) n-butanol detection thresholds (i.e. below 10% of normative data specific for sex and age group). b Olfactory identification: Cumulative percentage of participants with a normal (in black) or abnormal (in grey) UPSIT scores (i.e. below 10% of normative scores specific for sex and age group). *P < 0.05 compared to the two control groups
