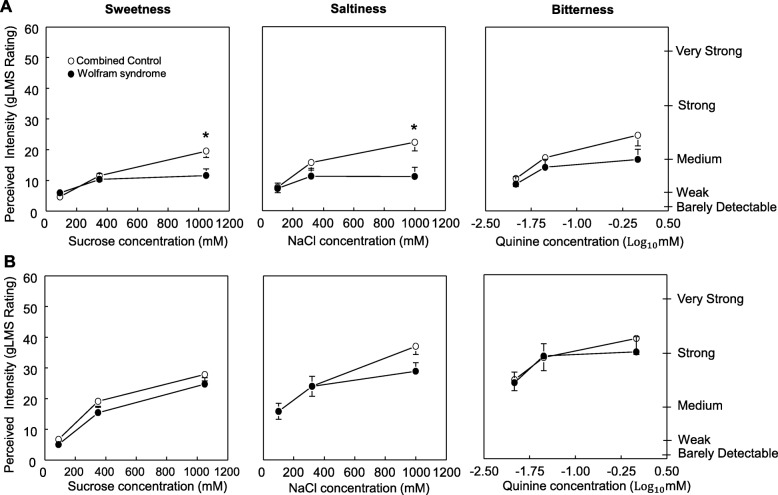
Fig. 2.
Taste function in participants with Wolfram syndrome and in the average of the two control groups without Wolfram syndrome (Combined controls). Perceived sweetness of increasing concentrations of sucrose, saltiness of increasing concentrations of sodium chloride, and bitterness of increasing concentrations of quinine hydrochloride. a Taste perception in the tip of the tongue and b in the whole mouth. The right axis shows descriptors visualized by participants when using the general labeled magnitude scale (gLMS). The left axis shows numbers corresponding to those descriptors on the scale. These numbers are not seen by subjects, but experimenters receive them from the computer program. Data are mean values ± SEM. *P < 0.05 compared to Combined control group

