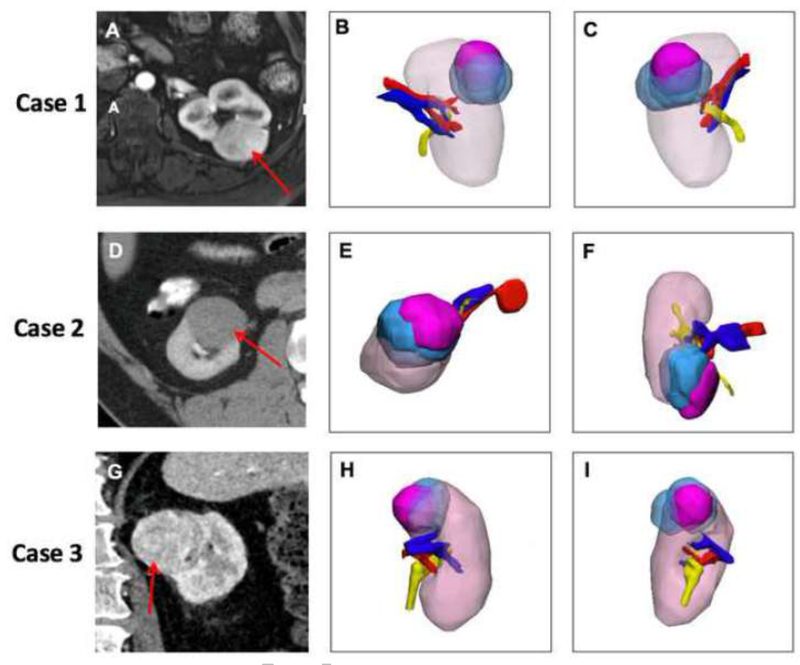
Figure 3:
Three cases with the maximum overlap (highest correlation) between actual lesion location and cognitive localization by surgeon after reviewing available images. The same color scheme as Figure 2 is used here. Case 1 is shown in the top row: (A) Axial post VIBE MRI with the lesion –red arrow, (B) 3D model demonstrating the kidney in the coronal orientation (anterior) and (C) 3D model posterior coronal view. Case 2 is shown in the middle row: (D) Axial CT with the lesion –red arrow, (E) 3D model demonstrating the kidney in the same orientation as imaging slice, (F) 3D model in coronal orientation demonstrating overlap between surgeon placed lesions and true lesion. Case 3 is shown in the bottom row: (G) Axial CT with lesion-red arrow, (H) 3D model coronal orientation, and (I) Sagittal view of 3D model demonstrating the overlap.

