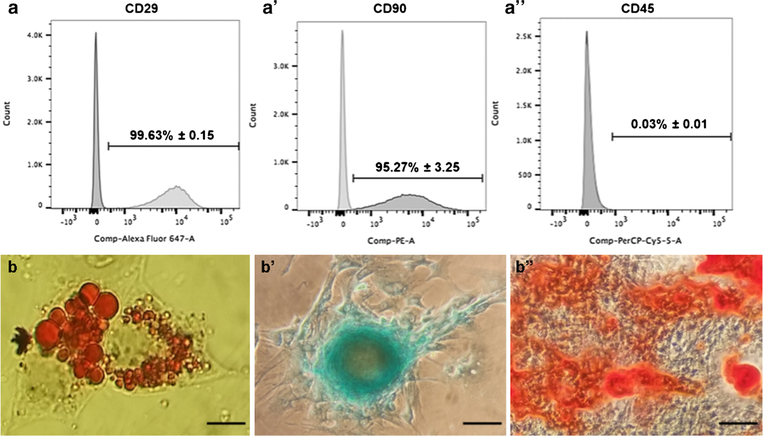
Fig. 1.
Characterization of pASCs. a Flow cytometry data for positive MSC surface markers (CD29 and CD90), and negative hematopoietic marker (CD45) is a negative marker for pASCs. Data presents percentage of cells positive for each marker. Data is represented as mean ± SD. b Left to right, adipogenesis (oil red O stain), chondrogenesis (alcian blue stain), and osteogenesis (alizarin red S stain). Magnification, × 80; scale bar = 10 μm

