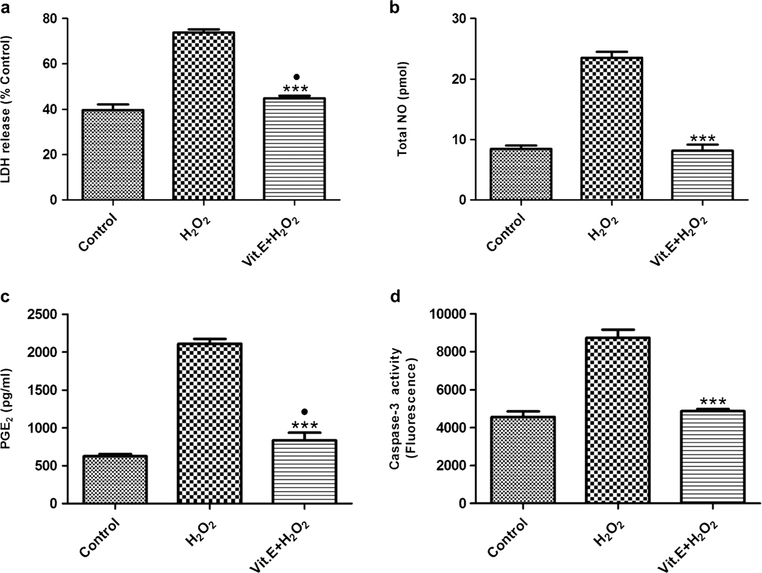
Fig. 3.
Biochemical analysis of pASCs. a LDH release in media compared to %Control that represents untreated pASCs lyzed by 1% Triton-X 100. b Total NO in media concentration as determined by the nitrate standard curve. c PGE2 in media as determined by PGE2 standard curve. d Caspase-3 enzyme activity of pASCs determined after cell lysis. All biochemical assays were performed at the end of the treatment period. Data is represented as mean ± SD. ●P <0.05 vs. Control, ***P <0.001 vs. H2O2

