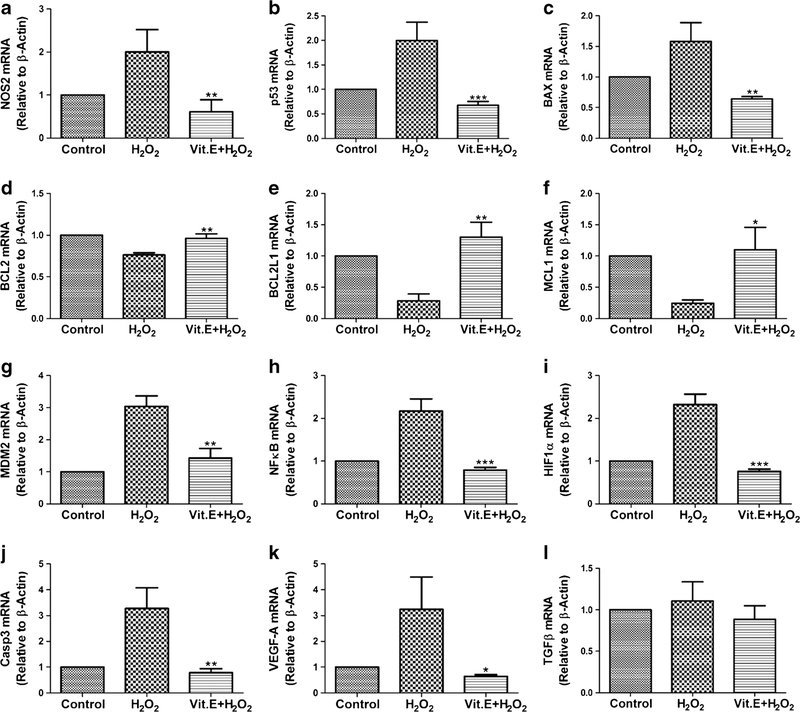
Fig. 4.
Gene expression analysis of pASCs. a NOS2 (oxidative stress marker), b p53 (apoptotic marker), c BAX (apoptotic marker), d BCL2 (anti-apoptotic marker), e BCL2L1 (antiapoptotic marker), f MCL1 (anti-apoptotic marker), g MDM2 (Surival marker), h NFκB (apoptosis regulator), i HIF1α (oxidative stress marker), j Casp3 (apoptotic marker), k VEGF-A (angiogenic marker), and 1 TGFβ (Differentitaion marker for chondrogenesis). Data is represented as mean ± SD. The gene expression of control was arbitrarily set to 1. **P <0.01 and ***P <0.001 vs. H2O2

