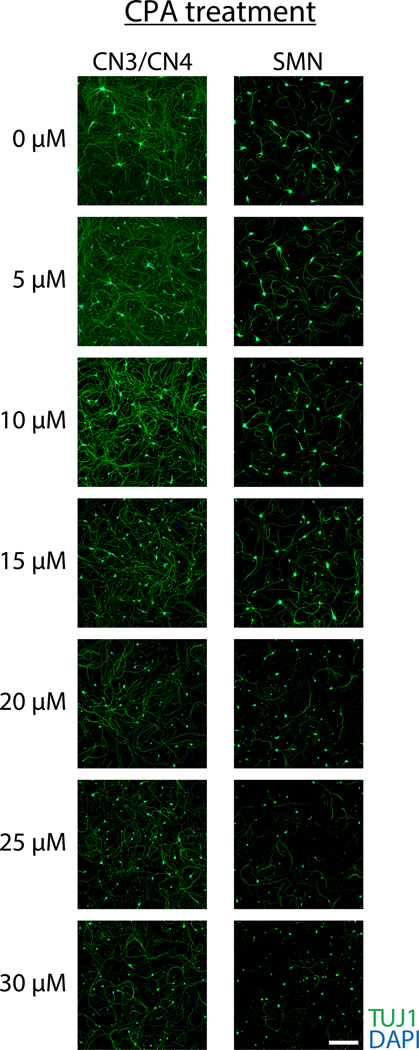
Figure 9. Representative immunocytochemistry of primary CN3/CN4 and SMN monocultures after 3-day exposure to increasing concentrations of CPA beginning at 2 DIV.
Neurons were analyzed by immunofluorescent labeling of cells with TUJ1 (green) and nuclei were counterstained with DAPI (blue). Primary CN3s/CN4s were more resistant to CPA treatment than primary SMNs. Images were captured under 10× magnification. Scale bar: 200 μm.

