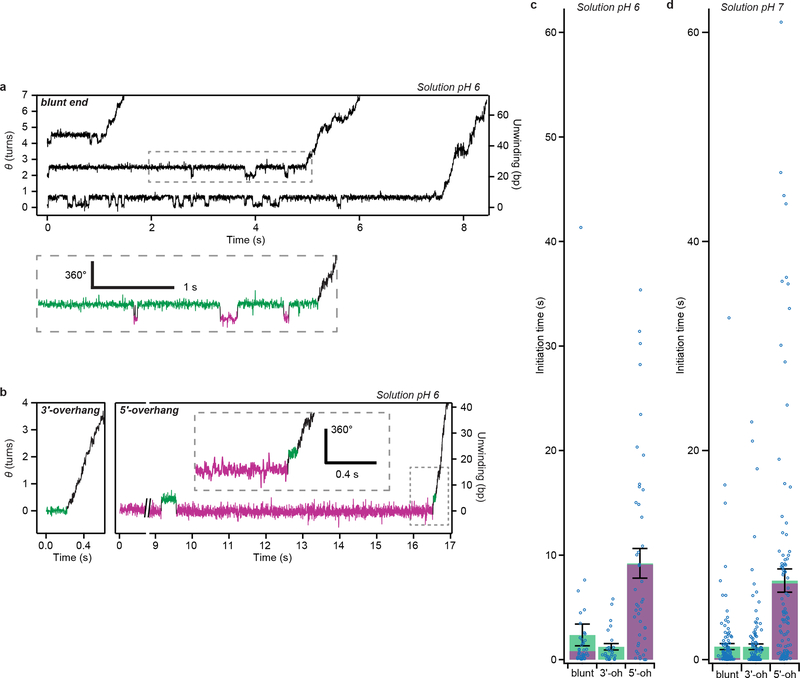
Extended Data Figure 9 |. RecBCD initiation kinetics at different pH values.
a, Single-molecule trajectories showing RecBCD initiation on blunt-end substrates at 50 μM ATP, solution pH 6, 10% glycerol, recorded at 500 Hz. Arbitrary vertical offsets are applied to different trajectories for display purposes. The region in the dashed box is magnified below, in which the wound and unwound angle states are marked in magenta and green, respectively. b, Single-molecule substrates showing RecBCD initiation on 3’ overhang (3’-oh, 6-nt) and 5’ overhang (5’-oh, 10-nt) substrates under the same conditions. The dash-boxed region is magnified in the inset. Data in (a-b) are representative of at least three independent biological replicates. c-d, Mean initiation-phase duration (total time from substrate binding until processive unwinding) for the blunt-end, 3’-oh and 5’-oh substrates at solution pH 6 (c) and solution pH 7 (d), 50 μM ATP, 10% glycerol. The green and magenta portions indicate the cumulative dwell times in the green and magenta states, respectively. Error bars are s.e.m (n = 40, 27, 44 trajectories in (c) and n = 149, 154, 108 trajectories in (d), from at least three independent biological replicates for each condition). Individual data points of initiation-phase durations are overlaid as dot plots.

