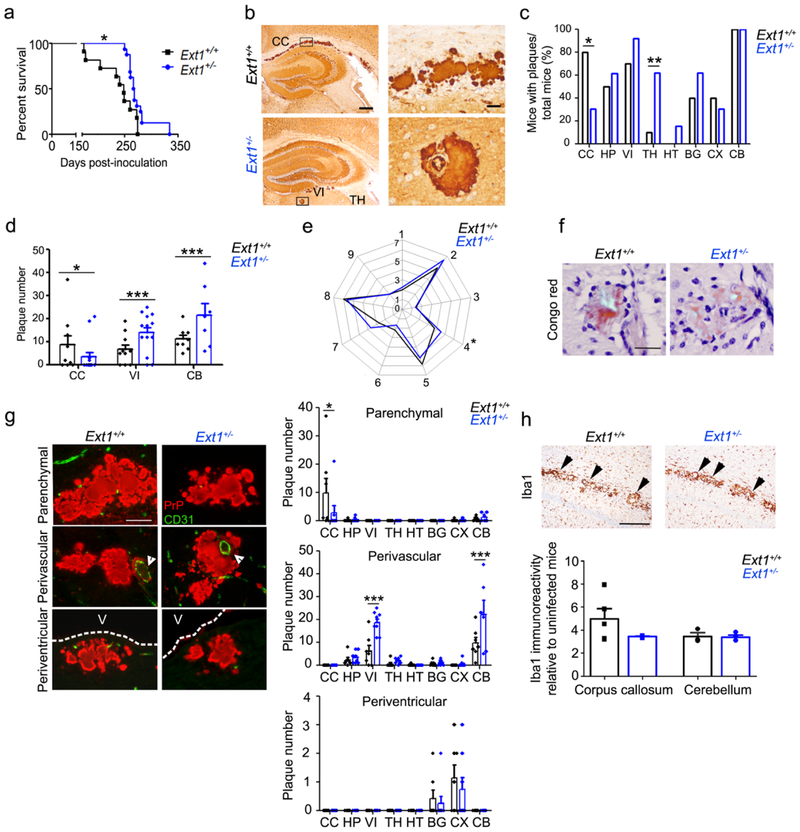
Fig. 2.
mCWD-infected tga20+/−Ext1+/− mice show prolonged survival times and altered plaque distribution. a mCWD-infected tga20+/−Ext1+/− (“Ext1+/−”) mice show a significant delay in survival time. b PrP immunolabelled brain sections show mCWD prion plaques in the corpus callosum (CC) of Ext1+/+ mice, whereas in Ext1+/− mice, plaques are present in other brain regions including thalamus (TH), and velum interpositum (VI). The plaque morphology was unchanged. c The distribution of mCWD plaques varied between the Ext1+/+ and Ext1+/− mice, as fewer Ext1+/− mice developed plaques in the corpus callosum (CC), whereas more Ext1+/− mice developed plaques in the basal ganglia (BG) and thalamus (TH) (HP: hippocampus, HT: hypothalamus, CX: cerebral cortex, and CB: cerebellum). d Ext1+/− mice show fewer plaques in the corpus callosum and more plaques in the velum interpositum and cerebellum. e Lesion profiles comparing spongiform degeneration, astrogliosis, and PrPSc deposition are similar in Ext1+/+ and Ext1+/− mice (1-medulla, 2-cerebellum, 3-hypothalamus, 4-medial thalamus, 5-hippocampus, 6-septum, 7-cerebral cortex, 8-cerebral peduncle and 9-cerebellar peduncle). f mCWD plaques are congophilic in Ext1+/+ and Ext1+/− mice [shown is cerebellum (Ext1+/+) and hippocampus (Ext1+/−)]. g Dual immunostaining for PrP and endothelial cells (CD31) shows typical non-vascular plaques in the corpus callosum (upper panels), perivascular plaques in the basal ganglia, and periventricular plaques adjacent to the lateral ventricle (middle panels, white arrowheads show blood vessel; bottom panels, V=ventricle). Ext1+/− mice show fewer parenchymal plaques in the corpus callosum and more vascular plaques in the velum interpositum and cerebellum. h Iba1 immunolabelling of activated microglia shows similar clustering of activated microglia around mCWD plaques in Ext1+/+ and Ext1+/− brain sections (arrowheads). Quantification of activated microglia shown in upper panel (for corpus callosum Ext1+/+: n= 5 and Ext1+/−: n= 3; for cerebellum Ext1+/+: n= 3 and Ext1+/−: n= 4). Scale bars = 500 μm (left) and 50 μm (right) (panel b), 50 μm (panels f and g), and 1 mm (panel h). *P< 0.05, Log-rank (Mantel-Cox) test (panel a). *P< 0.05, **P< 0.01, ***P< 0.001, Fisher's exact test (panel c), two-way ANOVA with Bonferroni’s post test (panels d and g), unpaired, 2-tailed Student’s t test (panel e). Ext1+/+: n= 11 mice; Ext1+/−: n=16 mice.

