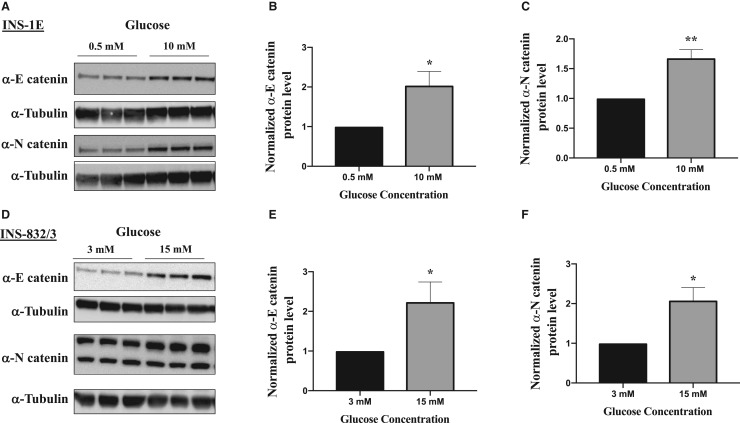
Figure 1. α-E catenin and α-N catenin protein levels increase with glucose stimulation.
After serum starvation in KRBH buffer, INS-1E cells (A) and INS 832/3 cells (D) were stimulated with 10 mM glucose or 15 mM, respectively for 3 h and lysates were subjected to western blot analysis using α-tubulin as a loading control. (B and C) Densitometry analysis of α-catenin protein levels in western blot images of INS-1E lysates and (E and F) INS-832/3 lysates. Results are mean ± S.E.M of three independent experiments. * P < 0.05 and ** P < 0.01 compared with control glucose condition as assessed by unpaired t-test (1B,C,E,F). Results are representative of least three independent experiments.

