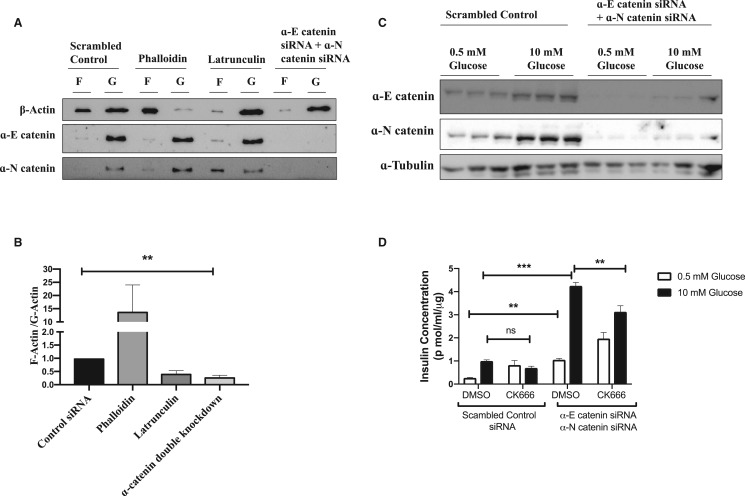
Figure 6. α-catenin depletion affects actin polymerisation in INS-1E cells.
INS 1-E cells were transfected with either control siRNA or siRNA specific for α-E catenin and α-N catenin siRNA. Phalloidin was used as a positive control for actin polymerisation while latrunculin was used as a negative control. (A) F-actin was separated from G-actin by ultracentrifugation and expression of F-actin and G-actin were analysed by performing western blot analysis using β-actin antibody. (B) F-actin and G-actin ratio was analysed by densitometry. Results are mean ± S.E.M of four independent experiments. * P < 0.05 and ** P < 0.01 compared with control siRNA as assessed by unpaired t-test. INS-1E cells were transfected with either control siRNA or siRNA specific for α-E catenin and α-N catenin. Forty-eight hours after siRNA transfection cells were serum starved and stimulated with 10 mM Glucose in the presence of either DMSO or CK666. (C) Lysates were used for western blot analysis to confirm the knockdown. (D) AlphaLIZA assays were performed to measure the secreted insulin concentrations. Results are mean ± S.E.M. * P < 0.05 and ** P < 0.01 compared with control/low glucose condition as assessed by two-way ANOVA.

