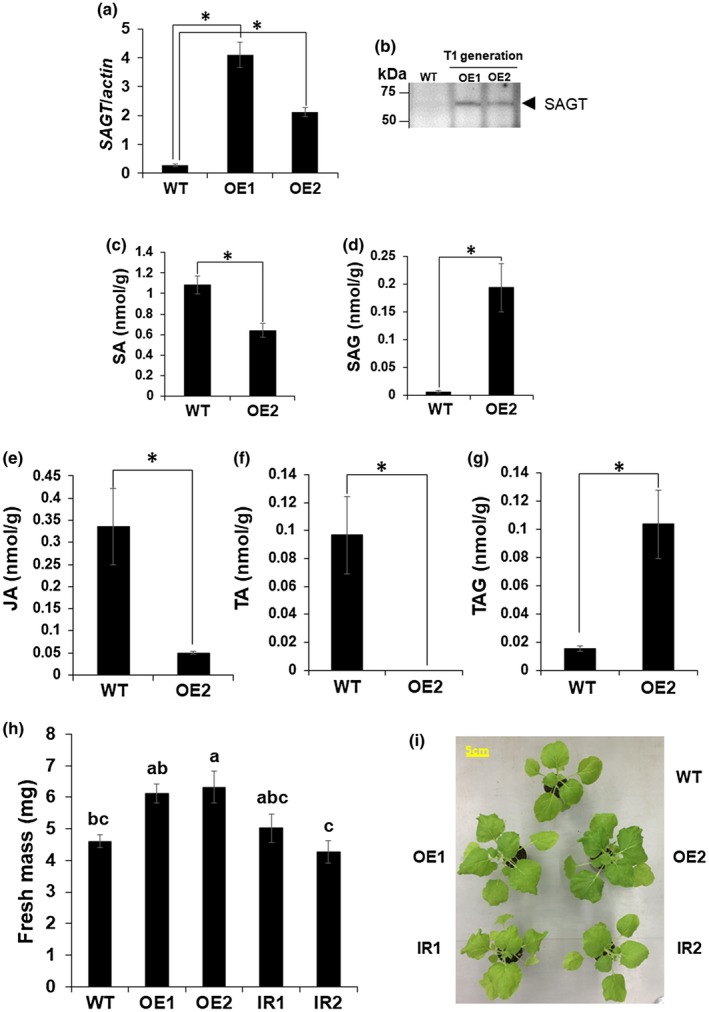
Figure 6.

Validation of SAGT‐overexpression and SAGT‐silenced Nicotiana benthamiana (Nb) lines. WT, wild‐type Nb plants. (a) Mean relative transcript levels (±SE) of SAGT in SAGT‐overexpression (OE1 and OE2) Nb lines were measured by quantitative reverse transcription PCR. Levels (in arbitrary units) are for individual plants (n = 4). *Significant difference between the OE1 (or OE2) and the WT Nb plants, according to Student's t test (p < .05). (b) Western blot analysis of SAGT protein overexpressed in OE1‐ and OE2‐transgenic Nb lines. SAGT was detected using anti‐SAGT peptide antibody. (c)–(g) Mean relative levels of (c) salicylic acid (SA), (d) SA 2‐O‐β‐D‐glucoside (SAG), (e) jasmonic acid (JA), (f) tuberonic acid (TA), and (g) tuberonic acid glucoside (TAG) (±SE) in OE2 Nb plants. Levels (in arbitrary units) are for WT and OE2 plants (n = 4). *Significant difference between OE2 Nb line and the WT Nb plants, according to Student's t test (p < .05). (h) Biomass of wild‐type (WT), SAGT‐overexpressing Nb lines (OE1 and OE2), and SAGT‐suppressing Nb lines (IR1 and IR2) at 14 days post‐treatment (dpt). Different letters denote statistically significant differences among the WT and the transgenic Nb lines (Tukey–Kramer method; p < .05, n = 7). (i) WT, OE lines and IR lines at 14 dpt. Whole plants were sprayed with benzothiadiazole (BTH) (0.12 mM)
