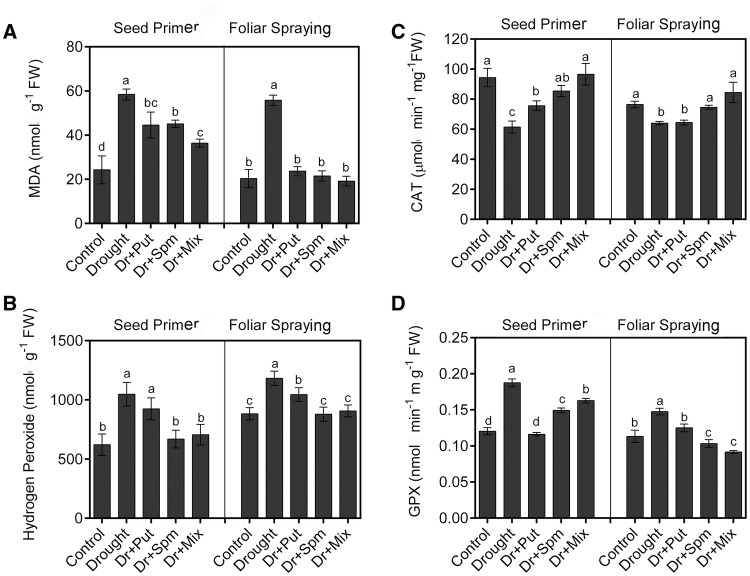
Fig. 3.
Changes in MDA, H2O2 content, and CAT and GPX enzyme activity in the leaves of the wheat cv. Sakha-94 21 DAS under drought with or without 100 µM PA application. a MDA content, b H2O2 content, c CAT activity and d GPX activity. Dr drought, Put putrescine, Spm spermine, and Mix mixture of Put and Spm. Data are the means ± SEs of 3 replicates. Bars labelled with different letters are significantly different at P < 0.05

