Figure 1.

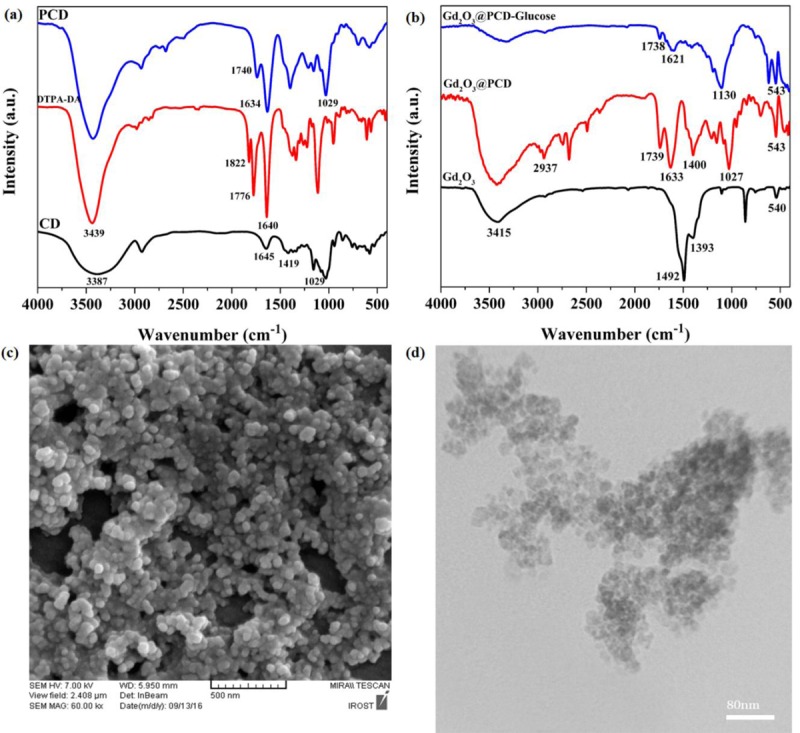
FTIR spectra of (a) CD, DTPA-DA and PCD. (b) Gd2O3, Gd2O3@PCD and Gd2O3@PCD-Glu NPs. (c) FE-SEM and (d) TEM image of Gd2O3@PCD-Glu NPs.

FTIR spectra of (a) CD, DTPA-DA and PCD. (b) Gd2O3, Gd2O3@PCD and Gd2O3@PCD-Glu NPs. (c) FE-SEM and (d) TEM image of Gd2O3@PCD-Glu NPs.