
Figure 2.
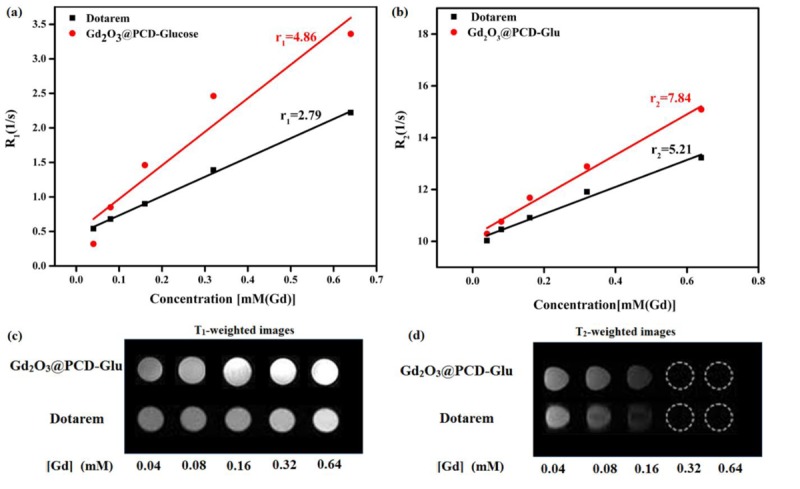
Magnetization curves of (a) Gd2O3 (b) Gd2O3@PCD-Glu. Magnetization (emu/g) plotted as a function of the applied field. (c): Hemolytic activity of Gd2O3@PCD-Glu NPs at concentration range of 1.95–1000 mg/mL (right to left). (d) XRD pattern of the Gd2O3@PCD-Glu NPs.