
Figure5.
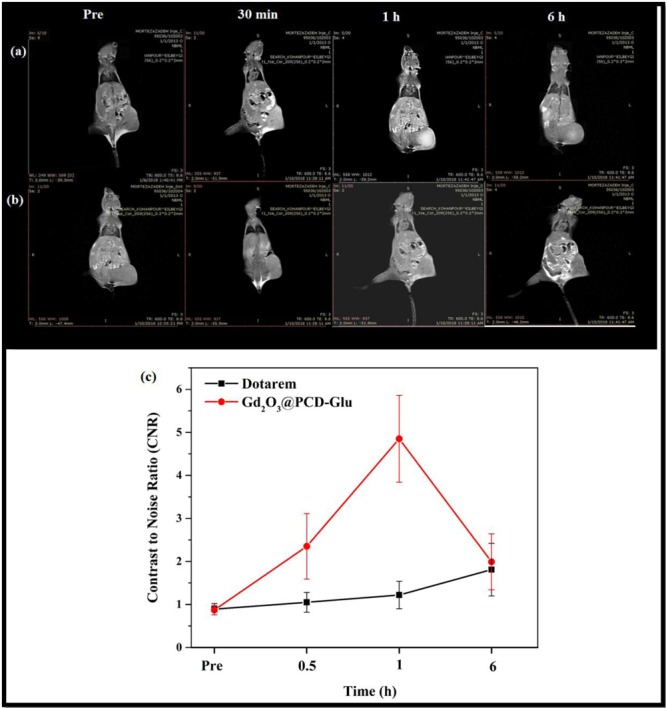
T1-weighted images of Mice tumor injected with (a) Gd2O3@PCD-Glu NPs and (b) Dotarem. (c) CNR analysis for T1-weighted images in tumor. Data represent mean ± SEM (n = 5), P-value < 0.05.
Official websites use .gov
A
.gov website belongs to an official
government organization in the United States.
Secure .gov websites use HTTPS
A lock (
) or https:// means you've safely
connected to the .gov website. Share sensitive
information only on official, secure websites.
T1-weighted images of Mice tumor injected with (a) Gd2O3@PCD-Glu NPs and (b) Dotarem. (c) CNR analysis for T1-weighted images in tumor. Data represent mean ± SEM (n = 5), P-value < 0.05.