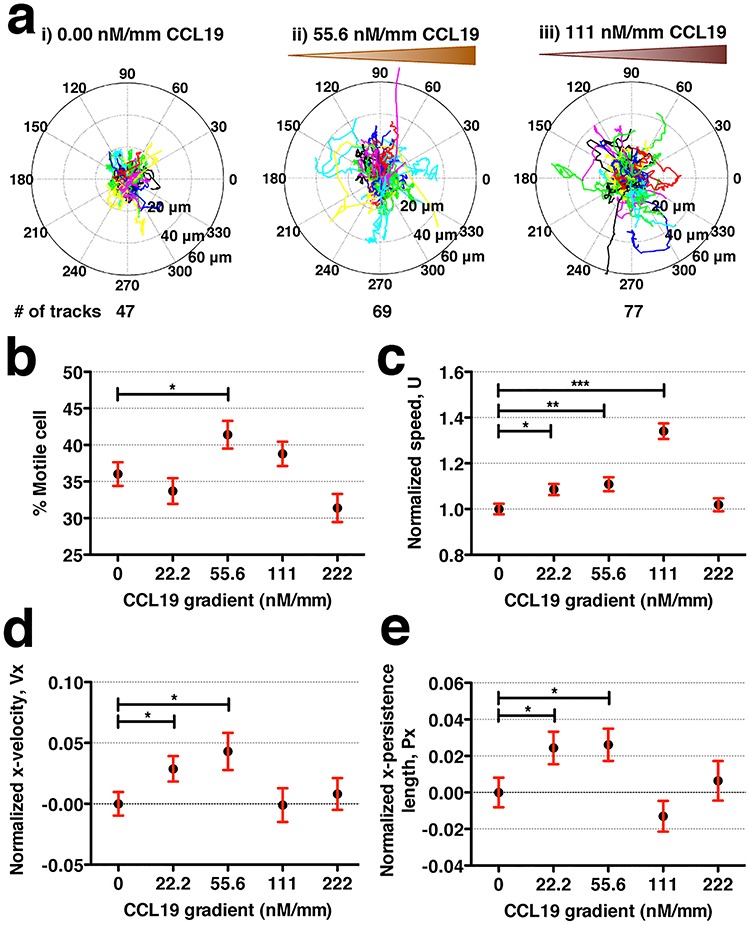
Figure 2.

MDA-MB-231 cells show distinct chemokinesis and mild chemotaxis behavior in CCL19 gradients. (a) Polar plots of cell tracks, each 8-h long, under the CCL19 concentration gradient of (i) 0, (ii) 55.6 and (iii) 111 nM/mm CCL19. (b) Percent of migrating cells at various CCL19 concentration gradients. Here, the definition for migrating cells is that the standard deviation of cell displacement in x-direction is larger than 2 μm and y-direction is larger than 2.5 μm in 16 h. (c–e) Normalized cell speed (c), normalized cell velocity along gradients (d) and normalized persistence length along gradients (e) under various CCL19 concentration gradients. Student t-test is used for statistical analysis with * for 0.01 < P < 0.05, ** for 0.001 < P < 0.01 and *** for P < 0.001.
