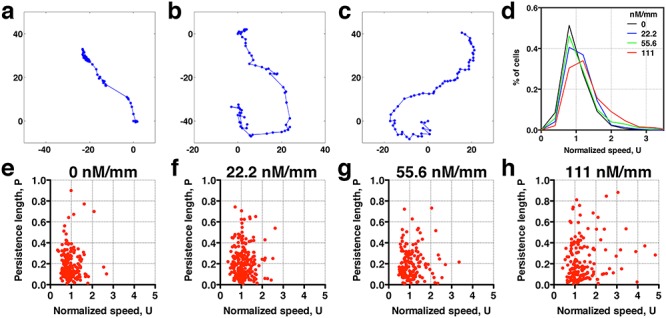
Figure 3.

Rare cell motility events are modulated by cytokine (CCL19) availability. Sample single-cell trajectories: (a) stop and go; (b) in-between ‘stop and go’ and ‘smooth’ track motion; and (c) smooth motion. Here, each dotted line is a cell track of about 16-h long; the time between the two consecutive dots is 8 min. (d) Distribution of normalized cell speed under various CCL19 gradients. The occurrence of fast moving cells increases with CCL19 gradients, indicating thicker tail distribution. (e and f) Scatter plots of persistence length and normalized speed in various CCL19 gradient: 0.00 (e), 22.2 (f), 55.6 (g) and 111 (h) nM/mm. Each dot represents data taken from one cell track. The number of cells is 244 in each of the four concentration gradients.
