
Figure 5.
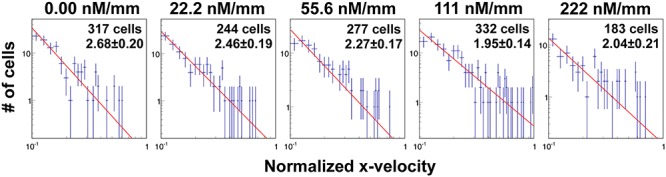
CCL19 gradients promoted the heterogeneity of tumor cell motility revealed by the Lévy exponent. Fit to a power law using the tail end of the x-velocity distribution. Dotted lines are experimental data taken at CCL19 gradients of (i) 0.00, (ii) 22.2, (iii) 55.6, (iv) 111 and (v) 222 nM/mm. The Lévy exponent decreases with the increase of CCL19 gradient and approaches to ~2.0 when the average CCL19 concentration is near ~111 nM.