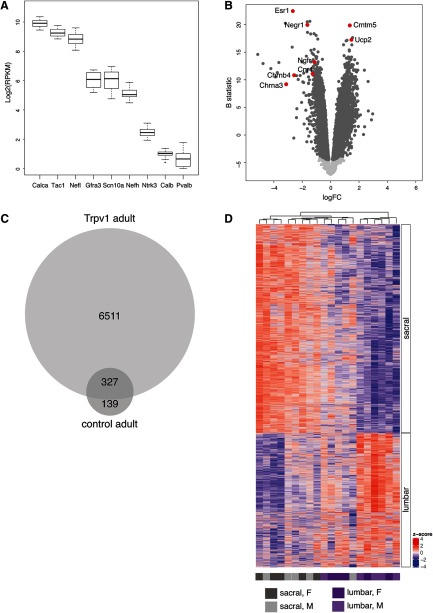
Figure 4.
Analysis of neurons isolated by flow cytometry to enrich the Trpv1 population from adult mice (five male, five female). A, Box plot of key markers associated with unmyelinated or myelinated DRG neurons; x-axis reflects gene of interest, y-axis reflects Log2(RPKM) gene expression. B, Volcano plot illustrating genes differentially expressed between Trpv1 lumbar and sacral DRG neurons. Light gray points are genes not differentially expressed, dark gray points are differentially expressed at adjusted p < 0.05; examples of specific differentially expressed genes are highlighted in red. A negative value for the FC indicates an upregulation in sacral DRG, whereas a positive FC indicates upregulation in lumbar DRG. Full dataset provided in Extended Data Figure 4-1. C, Proportional Venn diagram showing the number of genes differentially expressed between spinal levels, in the total adult DRG population and adult Trpv1 neurons. A total of 466 genes were differentially expressed (adjusted p < 0.05) between lumbar and sacral levels in the total population of adult DRG neurons, 327 of which were also detected as differentially expressed between lumbar and sacral levels in adult Trpv1 neurons. An additional 6511 genes were detected as differentially expressed (adjusted p < 0.05) between lumbar and sacral levels when only the Trpv1 neurons were included. Gene lists summarized in Venn diagram are provided in Extended Data Figure 4-2. D, Heatmap with hierarchical cluster for all differentially expressed genes (N = 6838; adjusted p < 0.05) for TRPV1 lumbar and sacral samples (N = 10). Both samples and rows are clustered using Pearson correlation. Heat color reflects row-wise z score, and samples are colored according to spinal level and sex. Ranked gene lists for heat map are provided in Extended Data Figure 1-2.

