Figure 7.
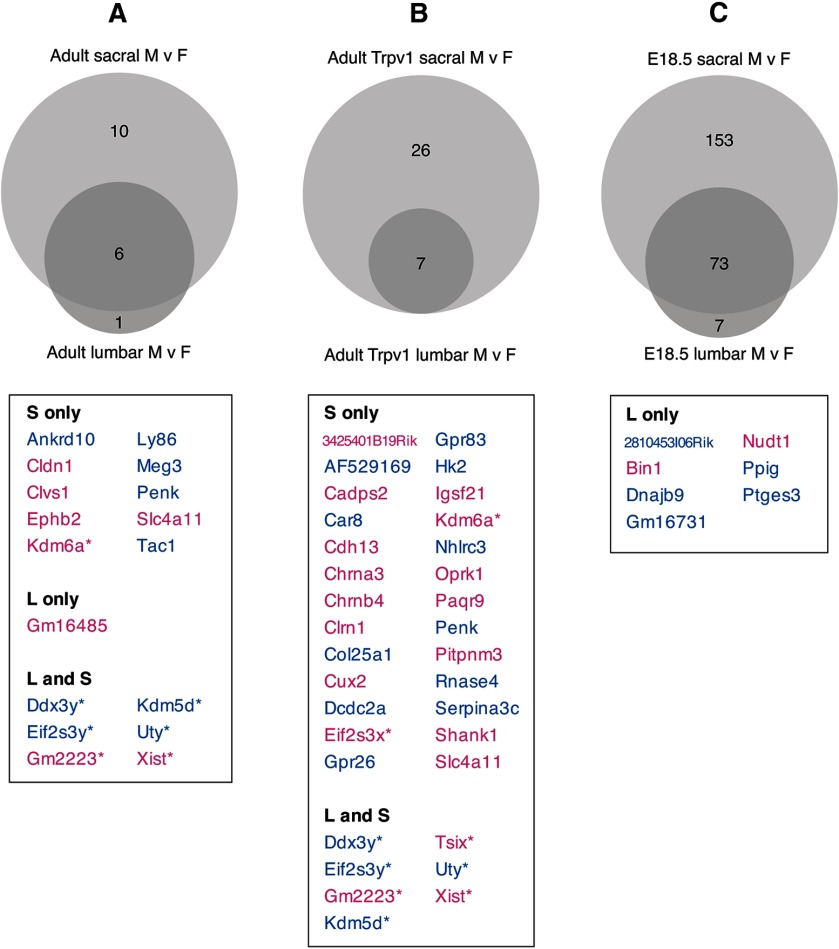
Sex differences in sensory neurons. Proportional Venn diagrams indicate the number of genes differentially expressed (adjusted p < 0.05) between male and female groups in each spinal region of adult (A), Trpv1 (B), and E18.5 (C) populations. A, In adult DRG, 17 genes were detected as differentially expressed between males and females; of these, 10 were differentially expressed only in sacral DRG, one only in lumbar DRG and six were differentially expressed between males and female DRG of both lumbar and sacral spinal levels. B, In the Trpv1 adult DRG neurons, 33 genes were detected as differentially expressed between males and females; of these, 26 were differentially expressed between sex only in sacral DRG, seven were differentially expressed between sex in DRG of both spinal levels and no genes were differentially expressed between sexes only at the lumbar level. C, In E18.5 DRG neurons, 233 genes were detected as differentially expressed between males and females; of these, 153 were differentially expressed between sex only in sacral DRG, seven only in lumbar DRG and 73 were differentially expressed between sex at both spinal levels. Where <30 genes were identified as differentially expressed between males and females, the specific genes are listed in the table below the relevant Venn diagram. These lists distinguish genes differentially expressed only in the lumbar or sacral levels, or differentially expressed in both levels. Genes listed in blue were upregulated in males, whereas genes listed in pink were upregulated in females. Asterisks indicate genes located on sex chromosomes. Full lists of differentially expressed genes for A–C are found in E. Full gene lists for A–C are provided in Extended Data Figures 7-1, 7-2, 7-3.

