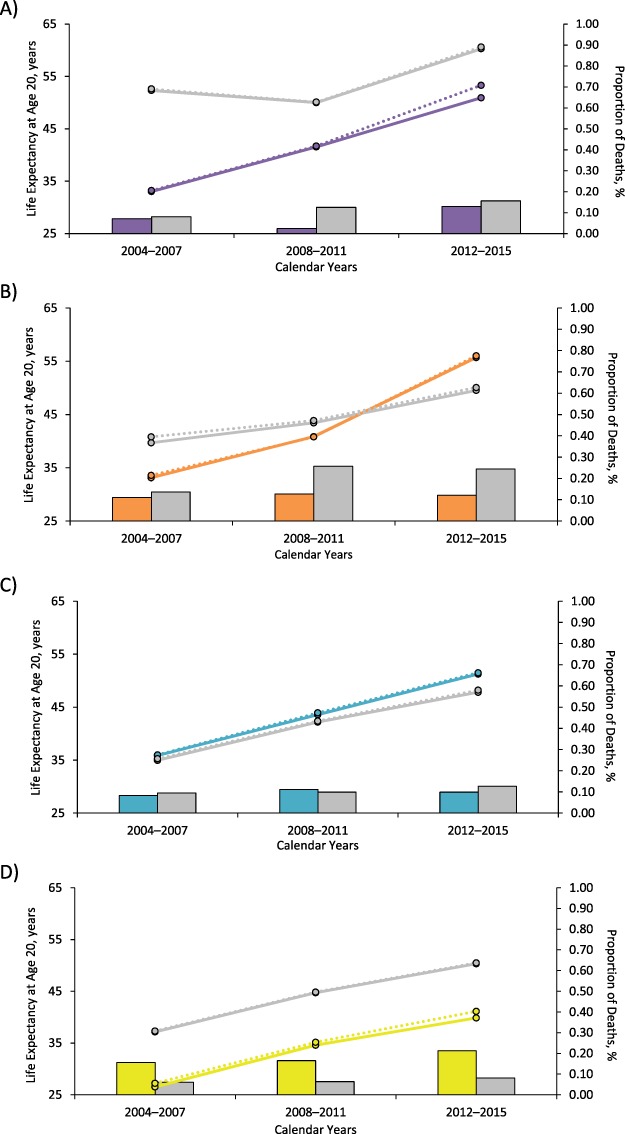
Figure 3.

Observed (solid lines) life expectancy from the North American AIDS Cohort Collaboration on Research and Design (United States and Canada, 2004–2015) and expected (dashed lines) life expectancy from the Lives Saved Simulation model, after a 20% reduction in drug- and alcohol-related deaths, as well as the proportion of drug- and alcohol-related deaths (bars) among key populations and their comparison groups, including black (purple) compared with white (gray) men who have sex with men (A), black (orange) compared with white (gray) women (B), Hispanic (teal) compared with non-Hispanic (gray) adults (C), and people who have a history of injection drug use (yellow) compared with those who do not (gray) (D). Expected life expectancy after a 20% reduction in drug- and alcohol-related deaths was estimated as the median estimate from 100 simulations using the Lives Saved Simulation model.
