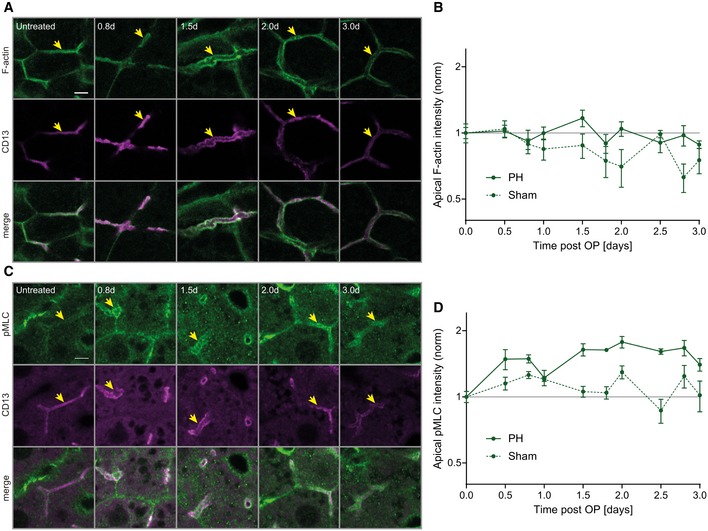
Figure 2. BC network dilation is accompanied by increased apical myosin levels during regeneration.

-
A–DFluorescence stainings for F‐actin (A) or pMLC (C) and the apical marker CD13 in the PV area on liver tissue sections from untreated mice or animals at indicated time points post‐PH. Arrows indicate BC. Scale bar, 5 μm. Quantification of apical F‐actin (B) and pMLC (D) intensity from images as representatively shown in (A and C) as well as Appendix Fig S2A and B, at indicated time points after PH (solid line) or sham OP (dashed line). Data are normalized to untreated animals (time point 0). Mean ± s.e.m, n = 3–5 (B) and n = 2–5 (D) mice per time point. Apical F‐actin of sham vs. PH time course, P = 0.03; apical pMLC of sham vs. PH time course, P = 0.003.
Source data are available online for this figure.
