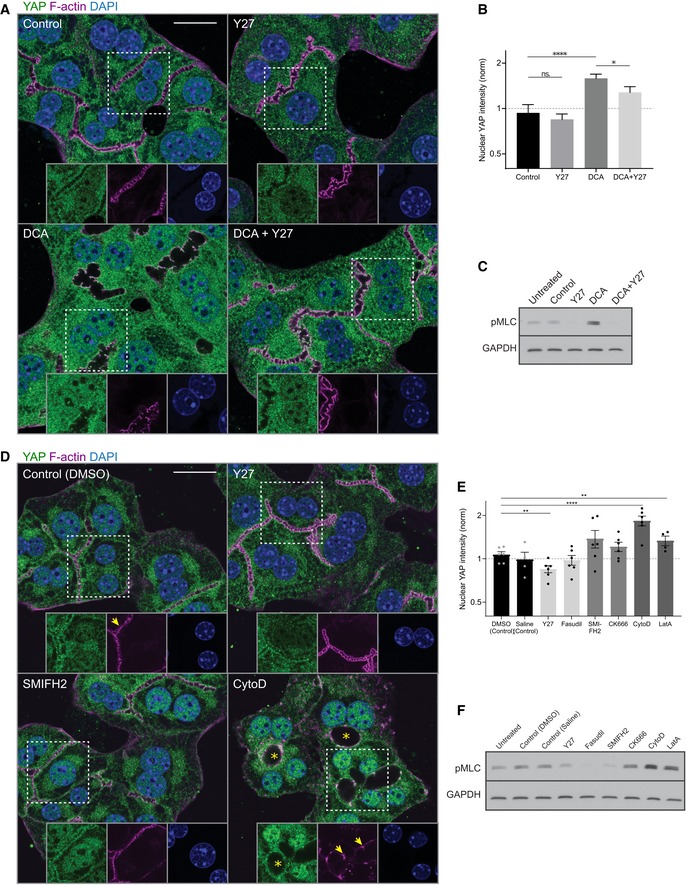
Fluorescence stainings for YAP (green) and F‐actin (magenta) and with the nuclear marker DAPI (blue) of primary hepatocyte cultures treated with DMSO (control), Y27, deoxycholic acid (DCA), or DCA + Y27 for ˜ 18 h. Indicated areas (dashed rectangle) are shown as magnifications in insets.
Quantification of the mean nuclear YAP intensity from fluorescence images of primary hepatocytes treated with DMSO (control), Y27, DCA, or DCA + Y27 for ˜ 18 h as representatively shown in (A). Data are normalized to untreated cells (not shown). Mean ± s.e.m., n = 7; DCA vs. DMSO, P = 8.98*10−5 (****); DCA + Y27 vs. DMSO, P = 0.05; Y27 vs. DMSO, P = 0.55 (n.s.); DCA + Y27 vs. DCA, P = 0.05 (*), t‐test.
Western blot of pMLC and GAPDH (loading control) of primary hepatocyte culture lysates. Cells were untreated or incubated for 18 h with the indicated compounds
Fluorescence stainings of primary hepatocytes for YAP (green) and F‐actin (magenta) and with the nuclear marker DAPI (blue). Cells were treated with DMSO (control), Y27, SMIFH2, or cytochalasin D (CytoD) for 6 h. Indicated areas (dashed rectangle) are shown as magnifications in insets. Note the dilation of canaliculi (asterisks) and fragmentation of F‐actin (arrows) upon CytoD treatment.
Quantification of the mean nuclear YAP intensity from images of primary hepatocytes treated with DMSO, saline, Y27, fasudil, SMIFH2, CK666, CytoD, or latrunculin A (LatA) for 6 h. Saline serves as control for fasudil, and DMSO serves as control for all other conditions. Inhibitors affecting similar actin processes are displayed in the same gray level. Saline, fasudil, CK666, and LatA conditions are not shown in (D). Data are normalized to untreated cells (not shown). Mean ± s.e.m., n = 3–5; DMSO vs. Y27, P = 0.002 (**); DMSO vs. CytoD, P = 5.11*10−7 (****); DMSO vs. LatA, P = 0.01 (**); DMSO vs. CK666, P = 0.15 (n.s.); DMSO vs. SMIFH2, P = 0.11 (n.s.); saline vs. fasudil, P = 0.92, t‐test.
Western blot of pMLC and GAPDH (loading control) in untreated or actin inhibitor‐treated primary hepatocyte culture lysates. Inhibitor treatments are the same as in (E).
Data information: Scale bars, 20 μm (A and D).

