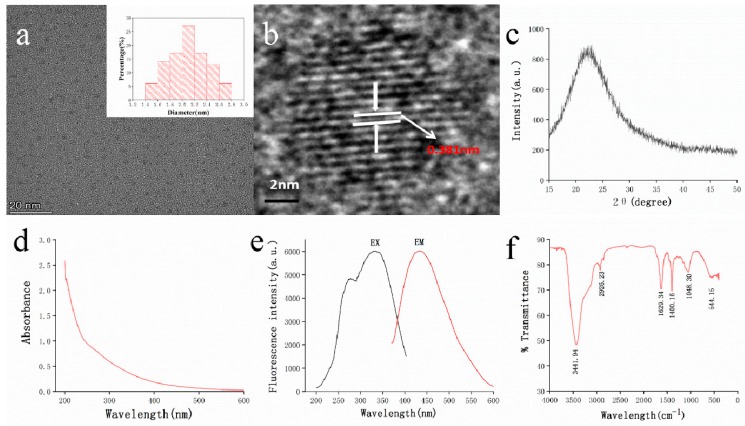
Figure 3.
Characterisation of STC-NPs: (a) Transmission electron microscopy (TEM) images of STC-NPs displaying ultra-small particles and TEM size distribution of STC-NPs (Upper right corner). (b) High-resolution TEM image of STC-NPs. (c) X-ray diffraction pattern. (d) Ultraviolet–visible spectrum. (e) Fluorescence spectrum. (f) Fourier transform infra-red spectrum.

