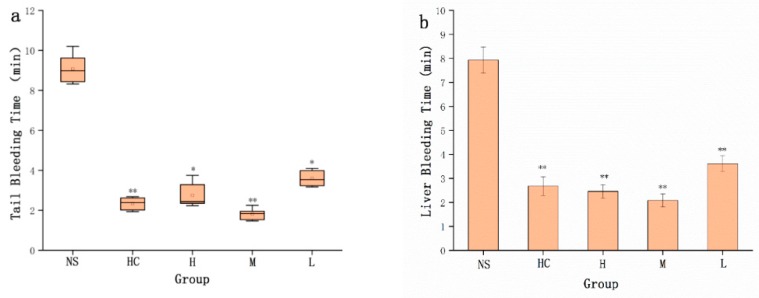
Figure 6.
Graphs of haemostatic time in mouse tail amputation and liver scratch models. (a) Tail amputation (n = 8) and (b) liver scratch (n = 8) models treated with normal saline (NS), haemocoagulase (HC), and high (H), medium (M), and low (L) doses of STC-NPs (16.67, 8.33, and 4.17 mg/kg, respectively). **p < 0.01 and *p < 0.05 compared to the control group (n = 8).

