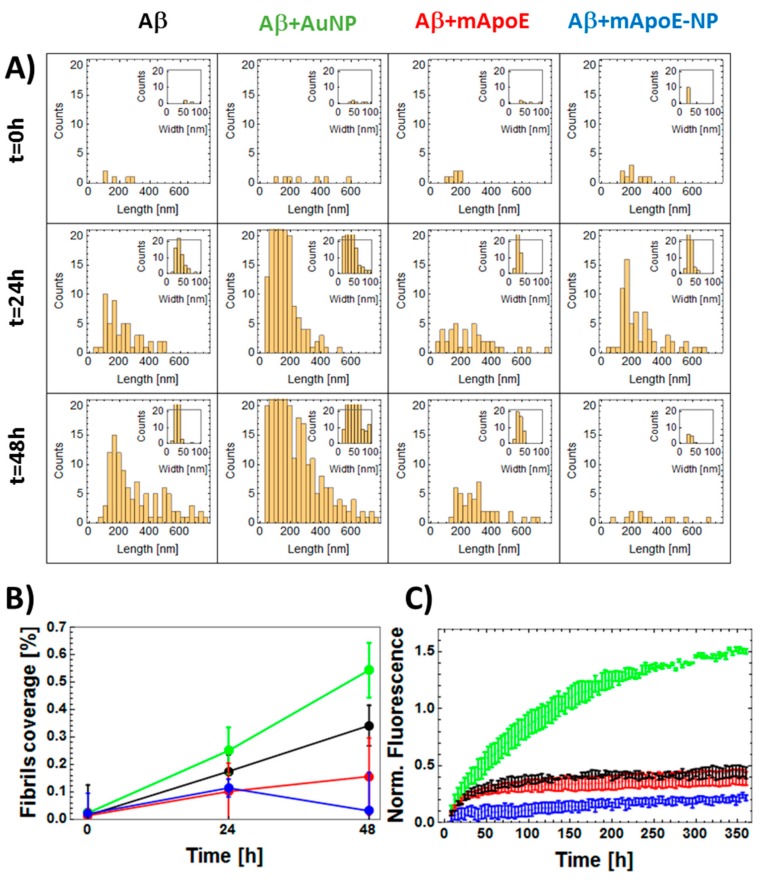
Figure 4.
Quantitative analysis of the effect of external chemical agents on the aggregation of Aβ1-42. (A) Statistical distribution of fibrils length (main figures) and width (insets) as obtained from the analysis of AFM data reported in Figure 3B. Similar to Figure 3, data obtained using treatments indicated by the top labels (bare Aβ1-42, Aβ in the presence of bare AuNP, free mApoE, or AuNP coated with mApoE) and left labels reporting the different incubation times (t = 0 h, t = 24 h, t = 48 h). (B) Quantitative analysis of AFM images reported in panel A. Percentage of deposited fibrils covering the surface plotted as a function of time of aggregation. Data obtained for Aβ1-42 bare in solution (black dots) or in the presence of free AuNPs (green dots), free mApoE (red dots), or AuNP coated with mApoE (blue dots). (C) FITC fluorescence representing the aggregation of 30 nM FITC-Aβ1-42 as a function of the aggregation time: free Aβ (black dots) is compared to Aβ added with bare AuNP (green dots), free mApoE (red dots), or AuNPs coated with mApoE (blue dots). The normalized fluorescence values are obtained as (F(t) − F(0))/F(0), where F(t) and F(0) are the fluorescence values measured at time t and 0. The normalized fluorescence values are the average of three repetitions. Error bars represent standard error.

